“We don’t make decisions in a vacuum – instead, we base them on our perception of a cohort.” This quote by marketing guru Seth Gordin sums up the importance of data in making sound decisions.
The numbers tell us where we are leading and what the chances of growth are. What results can we expect?
But in this pandemic, where the data keeps shifting, how can you visualize sales data and keep performing better?
The answer is a sales dashboard!
Sales dashboard with Dynamics 365 mapping gives you a visual representation of data. You can filter it by different periods while pulling in real-time data. It helps track various metrics such as conversion, sales funnel, revenue, etc. For instance, a sales leader can use KPIs to track performance and goal attainment, make decisions, adjust compensation/incentives, and identify issues.
But that doesn’t mean that a sales manager would need the same metrics. Their key goals might be different, and so might be of the on-field team. Hence, the Microsoft Dynamics Maps plugin provides six different dashboards to help exceed sales activities.
They are as follows:
1. Overview Dashboard
What’s the purpose of this dashboard? To get a business overview
Who is it for? Sales executives
When to use it? Everyday
How does it work?
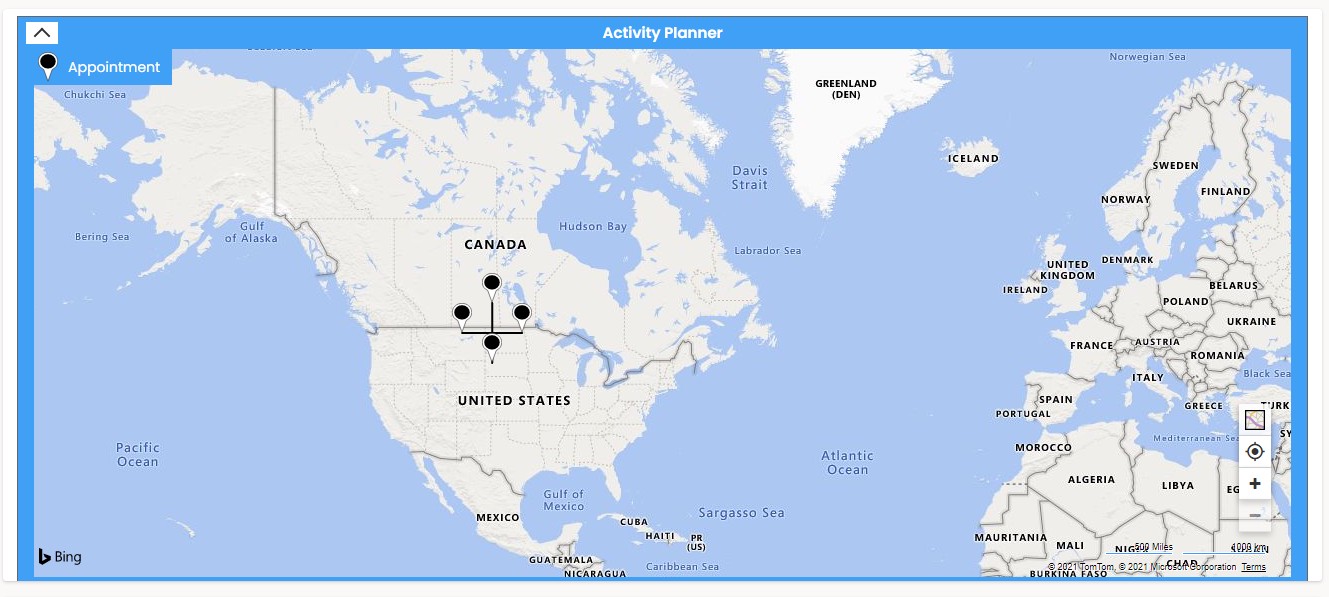
Think of the Overview dashboard as Siri giving you immediate updates about your tasks and plans for the day. You can view and plan your activities via an activity planner and even schedule routes based on the appointments. Sales leaders can view the opportunities for the month. Every salesperson can get an overview of their performance. The top 10 leads they can contact in a month or so.
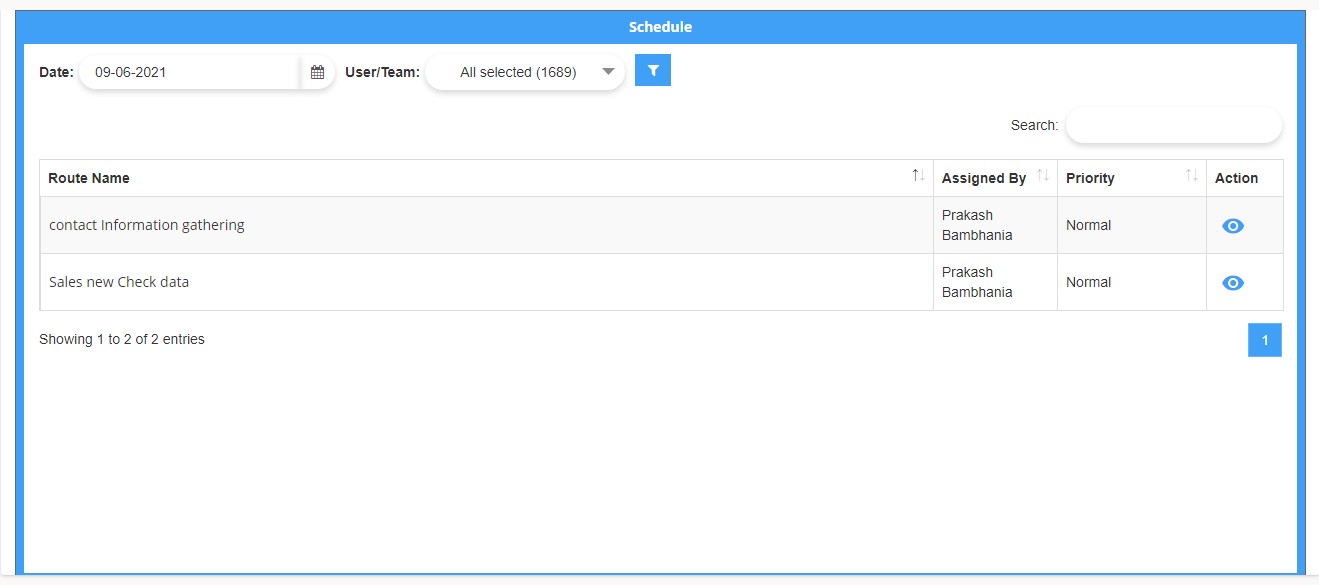
Sales managers can identify the overall working – everyone’s activities, appointments based on scheduled routes, lead opportunities, etc.
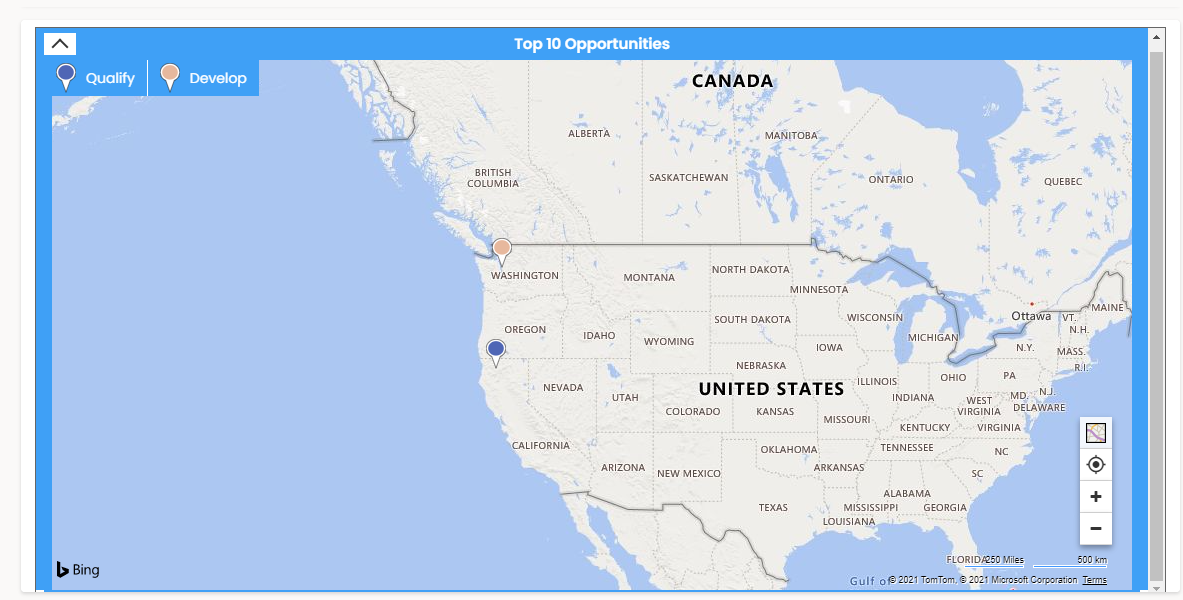
Microsoft Dynamics CRM Mapping’s overview dashboard provides a quick look at the overall metrics, helping sales managers and reps plan their day accordingly. It works like a routine planner, where you view your day’s tasks and then plan it – like 1 hour with this client, 2 hours for administrative work, etc. Next, you check your appointments and then sort them on a priority basis.
2. Sales Activity Dashboard
What’s the purpose of this dashboard? To evaluate the sales reps activities and ongoing tasks
Who is it for? Sales leader and sales manager
When to use it? Daily or weekly
How does it work?
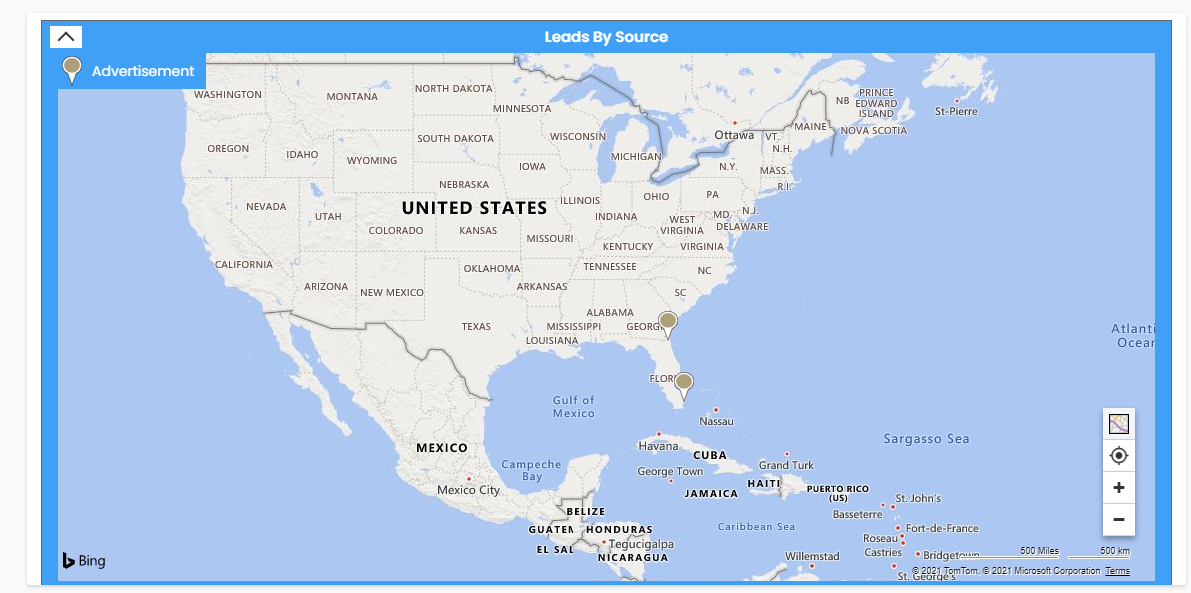
Microsoft Dynamics 365 Map helps sales managers visualize their reps’ activities daily with the help of an activity dashboard. With in-person meetings turning into Zoom and Google Meet, it’s essential to keep track of everyone’s activities. As a manager, you can’t keep calling everyone and asking about their tasks. So, this dashboard helps you identify how your sales team is utilizing resources and how they can use it in a better way. It provides you with raw data about your team’s activities. For example, total leads, sources, open leads of the month, the status of the leads, etc. You can even check invoices for the month.
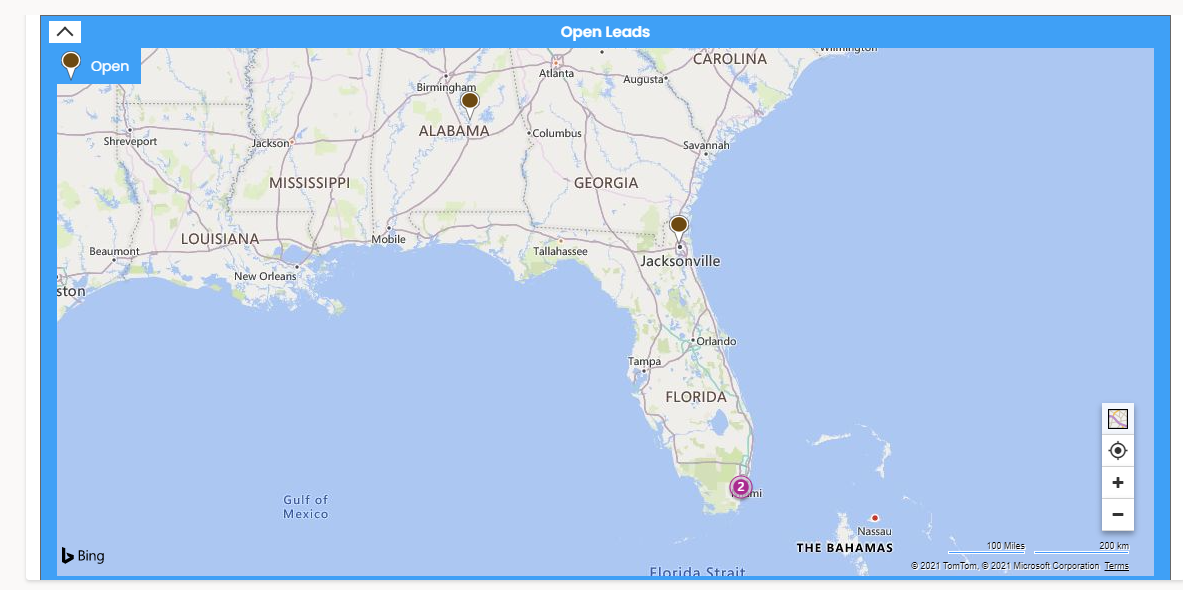
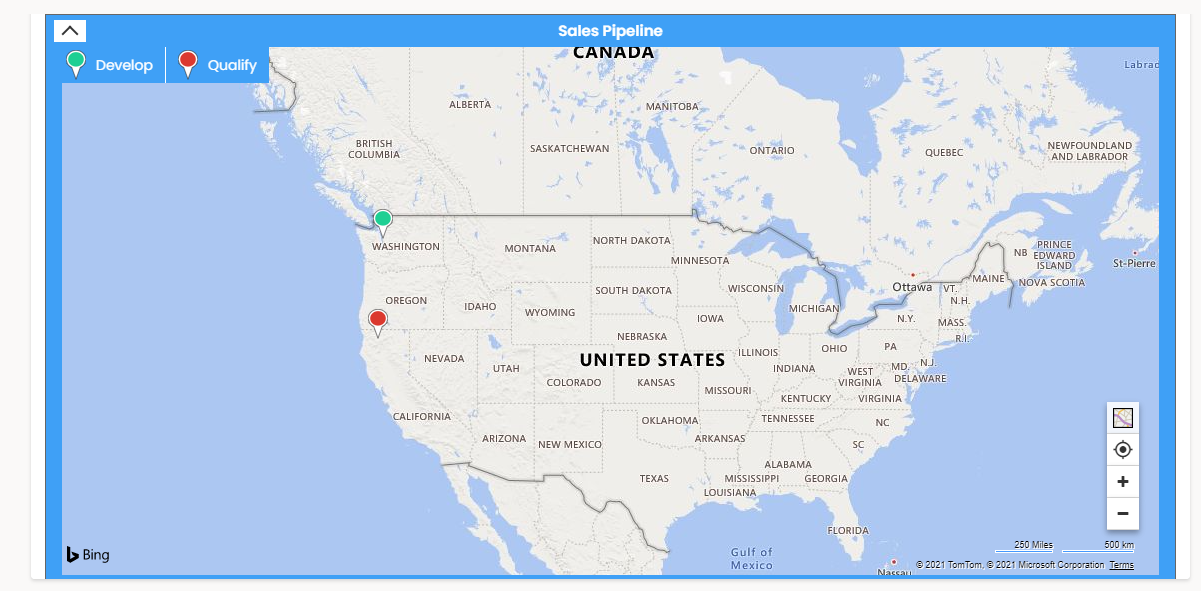
This dashboard facilitates communication. If your sales rep is on-field or working remotely, it will give you an idea of how they are doing and whether the tasks are completed on time or not. Also, broader information on the number of leads you won in a month.
3. Performance Dashboard
What’s the purpose of this dashboard? To identify whether the goals are attainable and if the team is working productively or not
Who is it for? Sales manager
When to use it? Weekly or biweekly
How does it work?
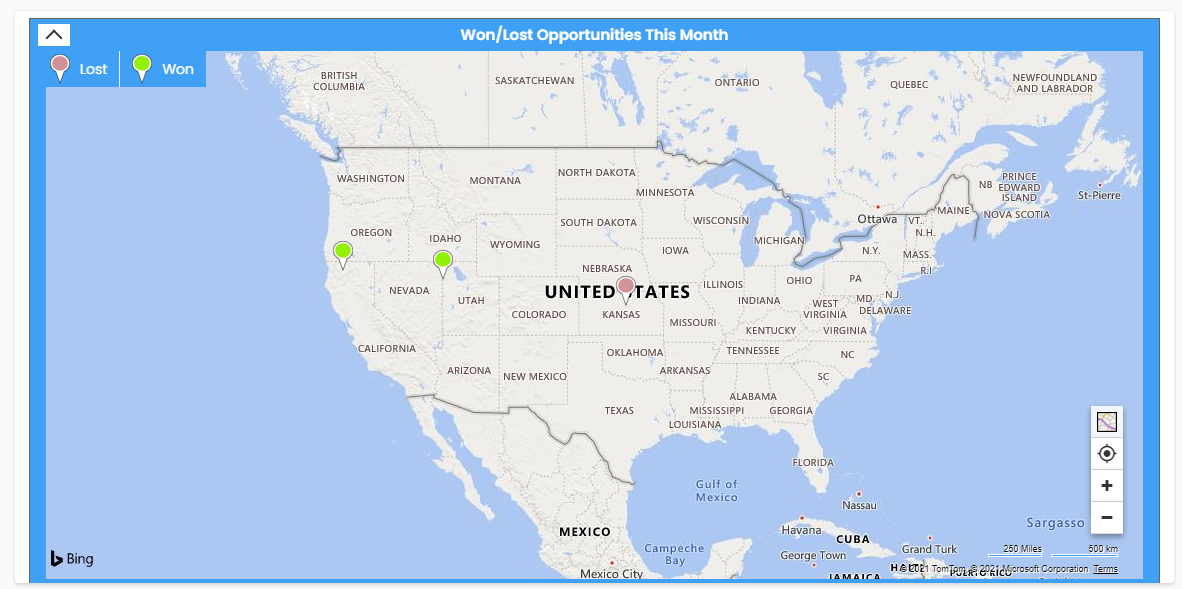
The sales performance dashboard features KPIs such as won/lost opportunities and new monthly leads. It helps evaluate the outcome of current opportunities and adjust the future ones. For example, if you find that you lost an opportunity due to a cost factor, you may look and revise the cost. Or a marketing strategy is not working in one area. You may look at the causes, how your competitors are working and act accordingly.
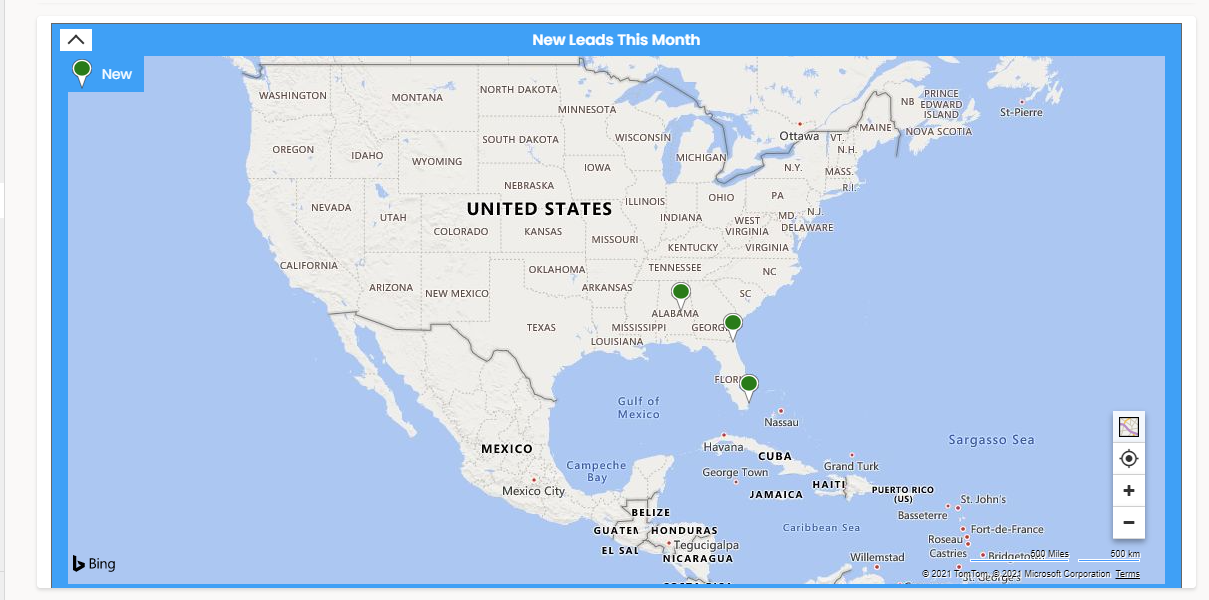
This dashboard by Microsoft Dynamics CRM Mapping helps everyone in the sales team identify the bottlenecks and monitor the performance to improve. For instance, you might notice that a sales rep could only convert 2 leads into customers but has generated 10+ leads in a week. This can help you offer the sales rep the tasks they are well acquainted with. It will help you provide everyone with suitable tasks based on their performance and maximize the profits.
4. Reporting Activity Dashboard
What’s the purpose of this dashboard? To get the summary of activities and leads
Who is it for? Sales leader and sales manager
When to use it? Daily or weekly
How does it work?
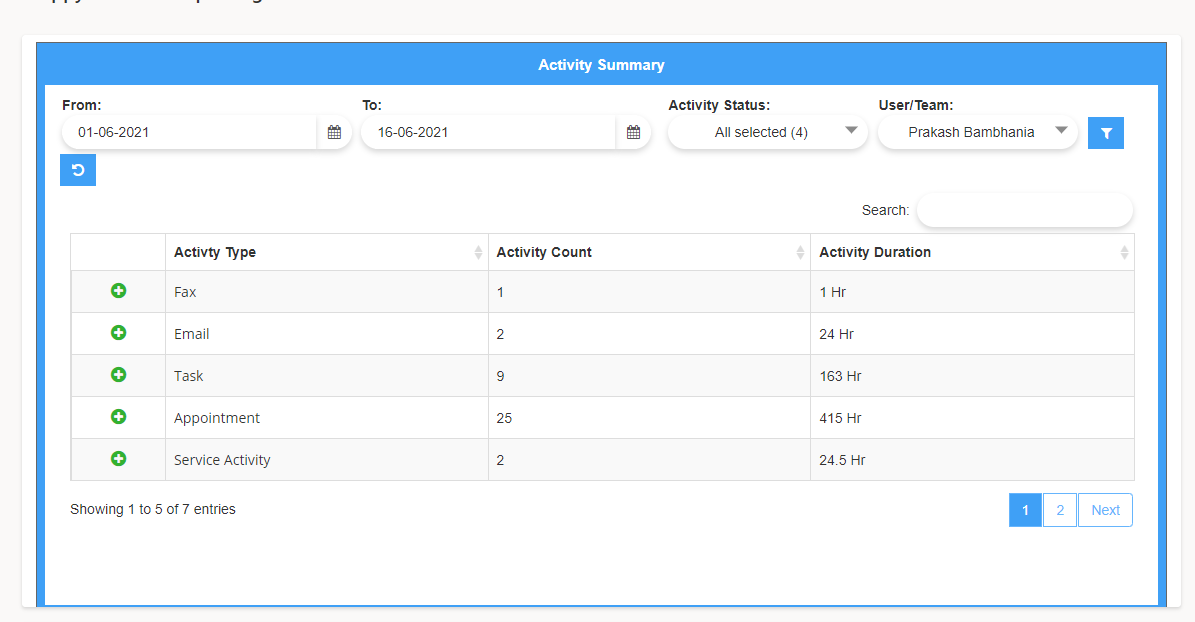
Think of it as the other side of the sales activity dashboard. As sales activity provides all the information related to sales, such as leads, conversions, and invoices, this dashboard overviews the activities, routes, and internal processes. For instance, a development team will give an overview of the development process. They will explain the features from a development point of view. A marketing team will present it from the users’ perspective. It means both will have a clear idea of their roles and processes. Similarly, the reporting dashboard works as a complement to sales activity, providing a summary of activities, routes, work hours tracking, etc.
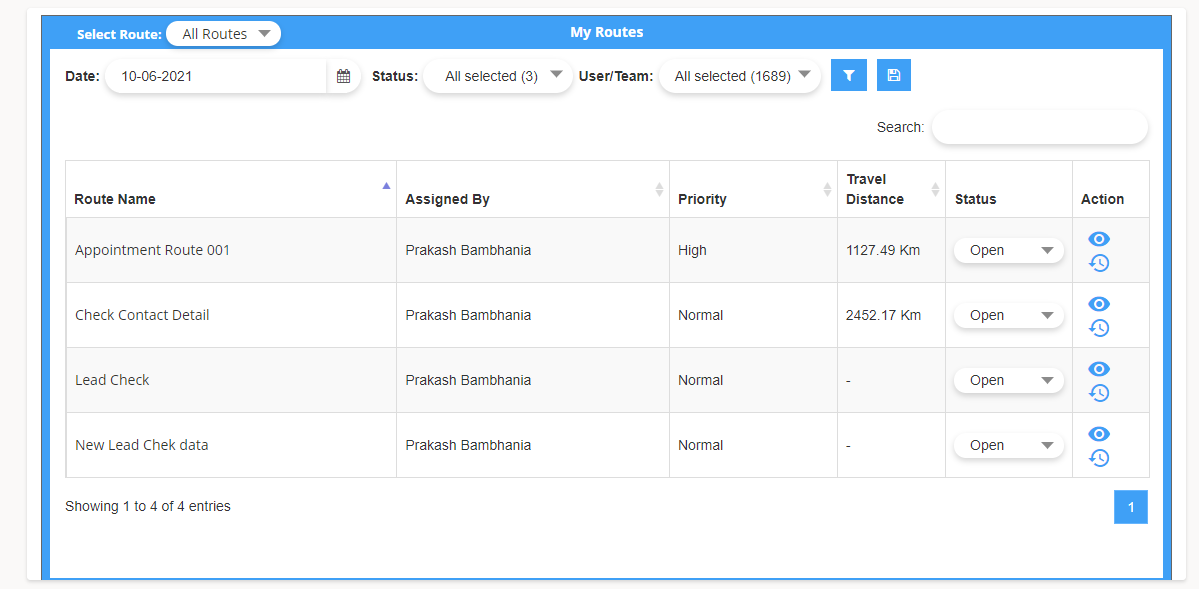
It provides real-time information and helps sales managers to stay focused on the current and upcoming activities.
5. Services Dashboard
What’s the purpose of this dashboard? To manage customers’ expectations and resolve problems
Who is it for? Customer service managers and executives
When to use it? Everyday
How does it work?
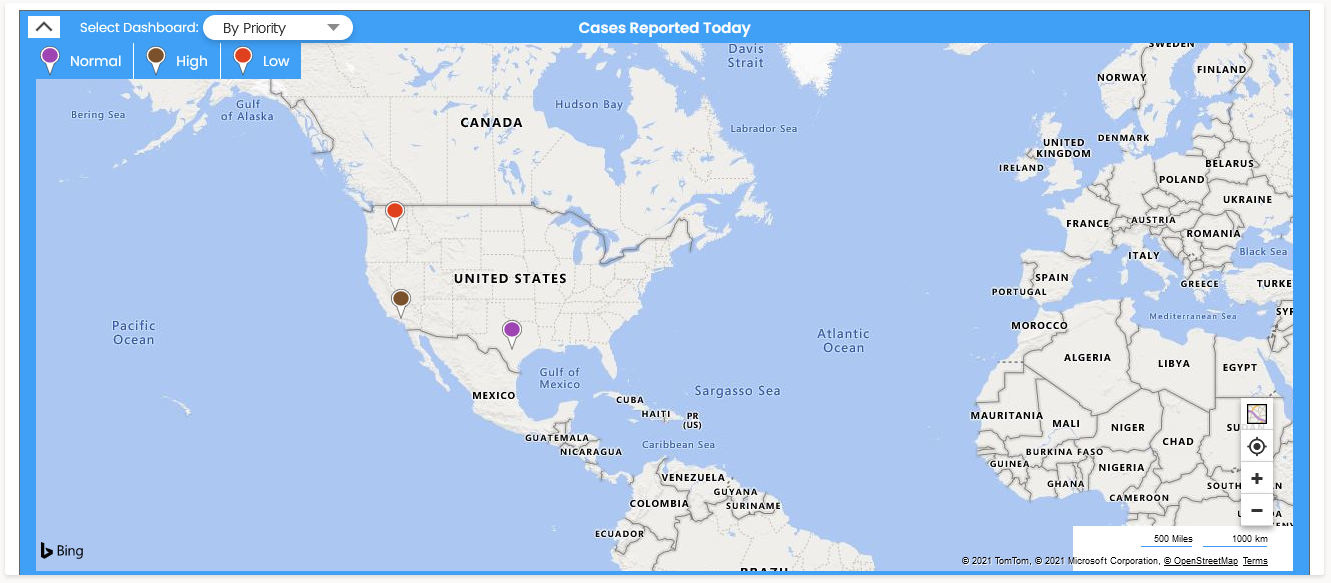
The service dashboard helps you monitor your business’ service level, customer satisfaction, and overall department performance. It ensures that customers’ issues and complaints are dealt with promptly by measuring KPIs such as ticket volume, cases resolved, average reply and resolution time, etc. Using this, you can identify the problems in the process and resolve them.
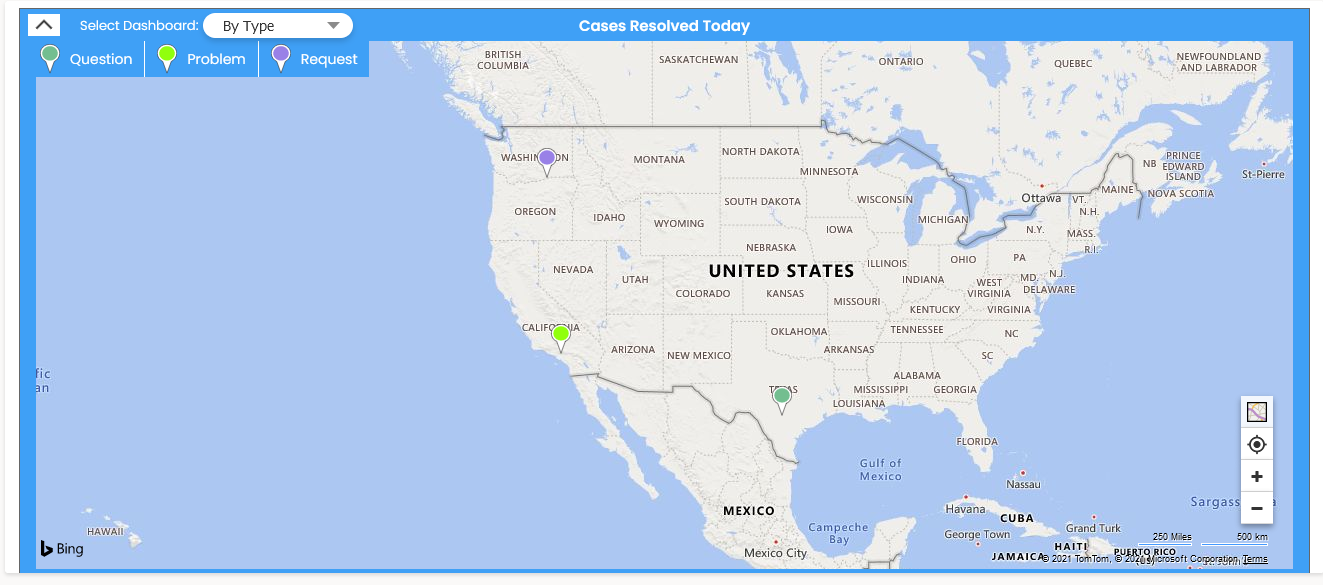
Service dashboard allows you to track all the customers’ requests from one place – this helps make the ticket organization and prioritization easy. You can even automate the tickets using the portal to minimize the efforts your team needs to put in.
6. Custom Dashboard
What’s the purpose of this dashboard? To view the records just the way you want
Who is it for? Every team member
How does it work?
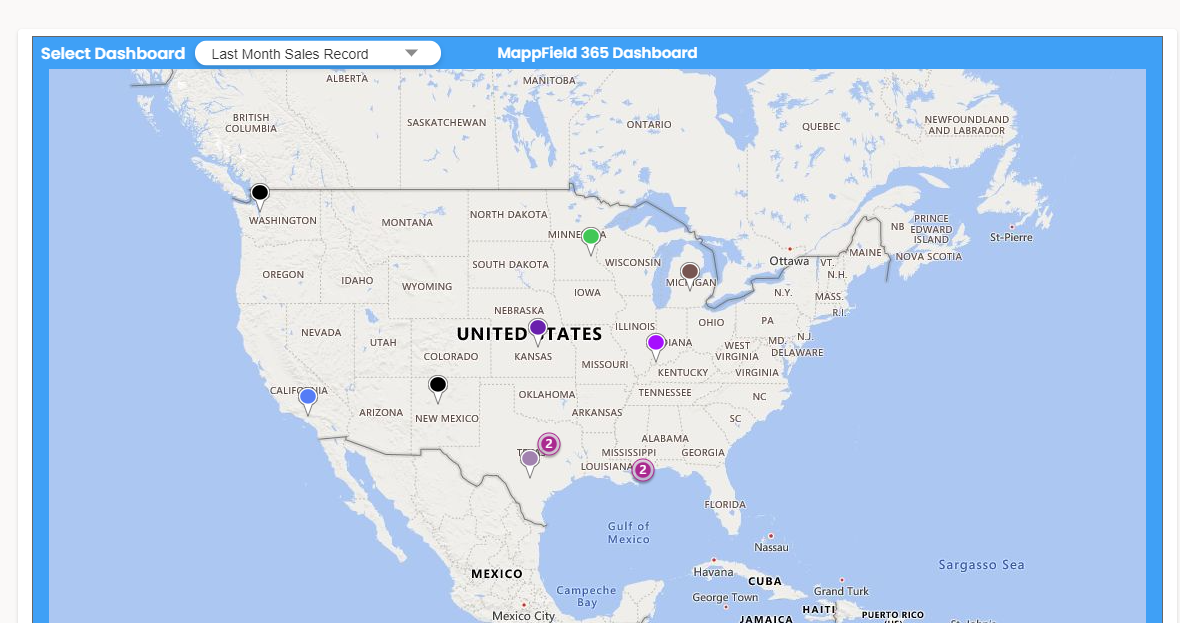
We know that one size doesn’t fit all. So, the Microsoft Dynamics Maps plugin allows you to create a custom dashboard. You can select the entities and configure the dashboard accordingly. For instance, if you want to view your sales reps’ log-in and log-out time on the dashboard, you can add it. If you want a separate deals dashboard, where you can view all the deals at every stage and compare it with your goals, go ahead, add the entities, select the relevant name, and customize it.
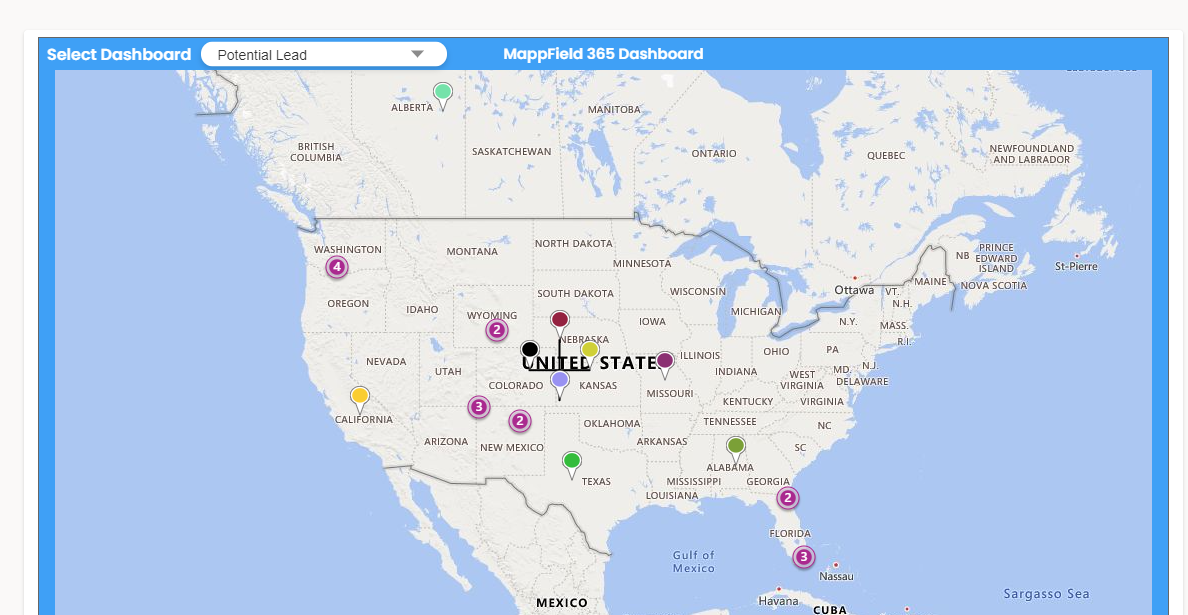
This dashboard gives you the freedom to add and delete entities as per your requirements. It helps you view the information quickly and efficiently.
Hence, the next step is to
Bring in a mapping tool that offers six different dashboards to get a 360 degree perspective on the business operations, performance, and weak points. Dynamics 365 Map helps sales teams make sound decisions with dashboards and other features like heat maps, territory management, route optimization, auto-scheduling, live tracking, etc.
You can share the optimized routes with your on-field, track what they are doing in real-time without calling or texting them, and do a lot more.
All product and company names are trademarks™, registered® or copyright© trademarks of their respective holders. Use of them does not imply any affiliation with or endorsement by them.


