Being a Sales Manager / Head of the team, you need to understand and survey the current sales activities, planning for upcoming leads/opportunities, and any pending inquiries. So you will require specific records for the sales to boost the sales activities and keep all the work in line.
Dynamics 365 map integration provides to search the category wise records for the selected entities from the map. From an individual ‘Category’ option, you can easily choose the category to the entity records.
Follow the below steps to search the category wise entity records:
- Select the Entity and plot the records
- Select the category for the entity (Records will plot as per the Category selection)
- Navigate to the selected entities from the right-side panel (Category Slider)
Step 1: Navigate to MappyField 365
Select “MappyField 365” from the Dynamics 365 dashboard or app list from the header.

Step 2: Plot the records on the map
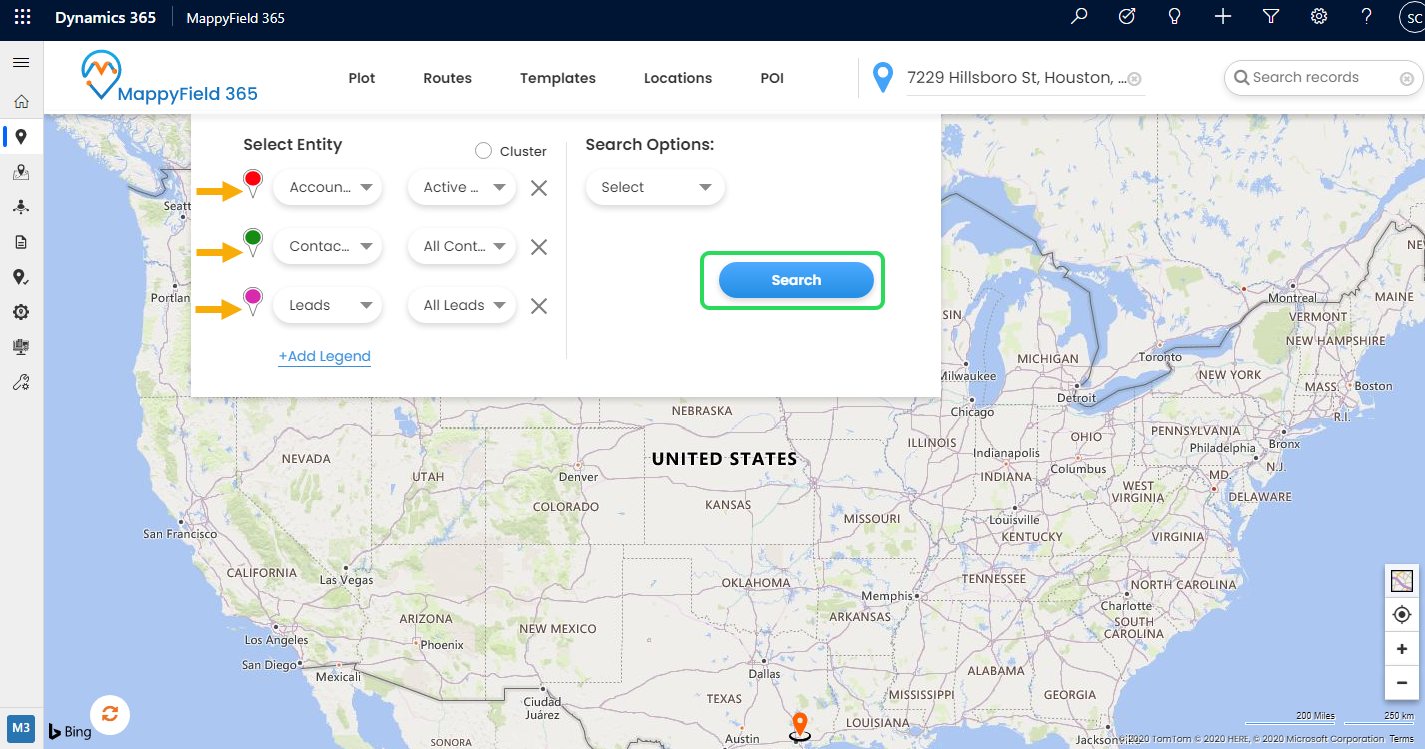
Plot the records on the map by selecting the ‘Entity’ and its ‘View.’ Here, three entities are selected: Accounts, Contacts, and Leads to plot the records.
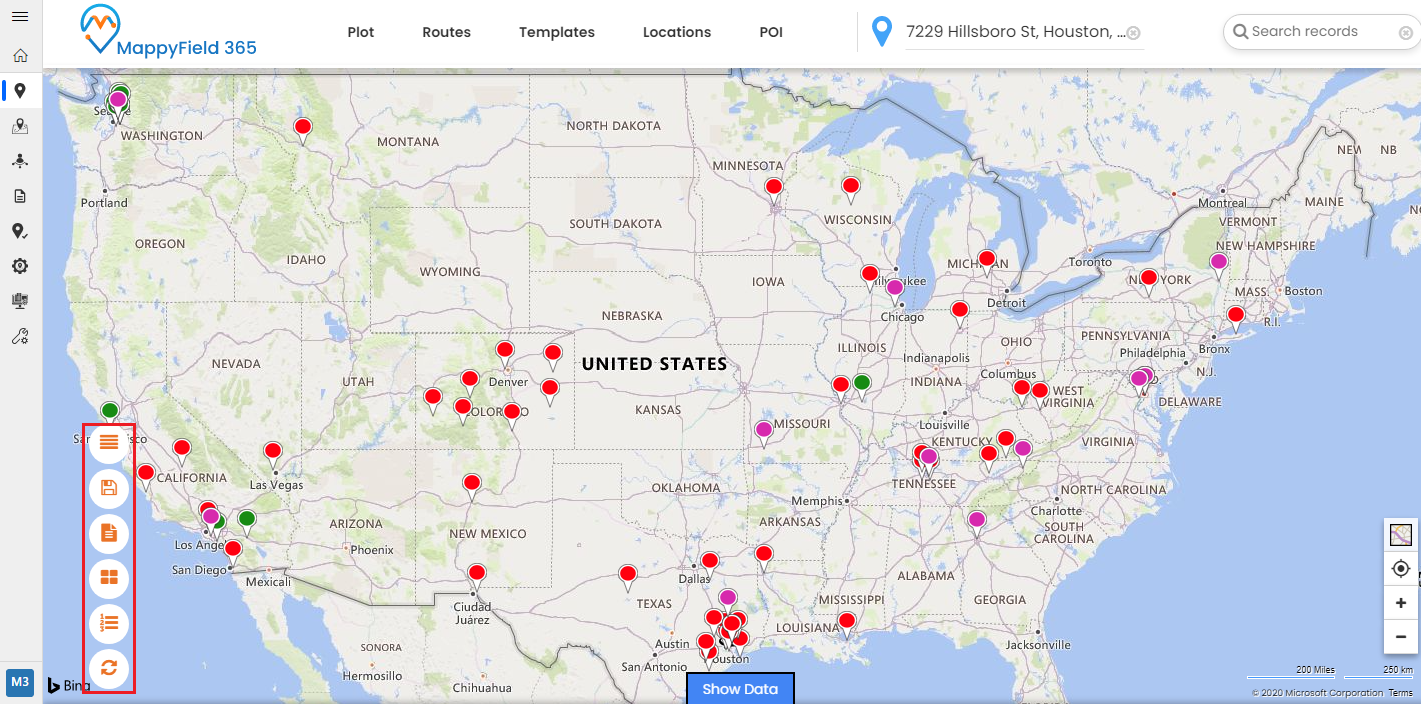
The records are plotted on the map. The advance options are provided from the left to perform the actions and manage the planned records.
Step 3: Click on the Category option
The records of three different entities are plotted on the map.
By clicking on the ‘Category’ option, you can select the field for the entity for which you want to categorize the data on the map.
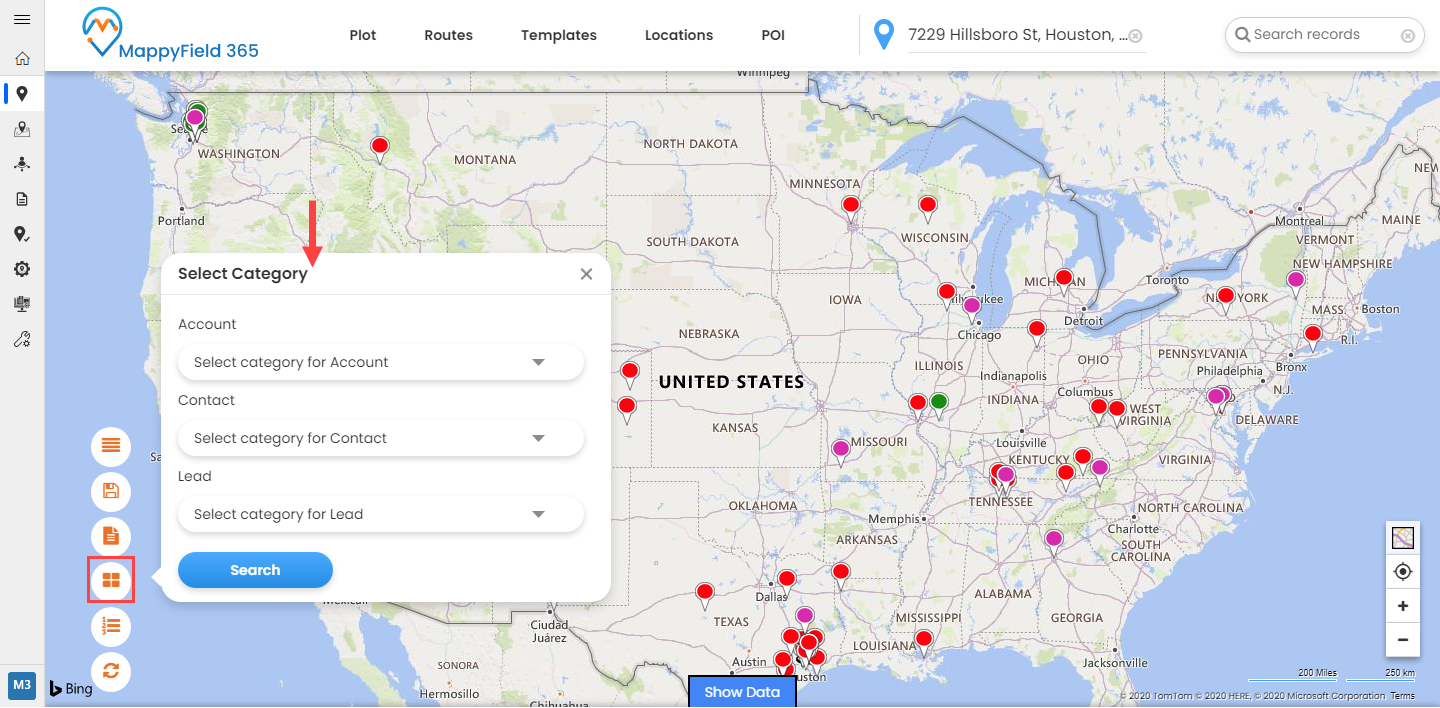
For Account:
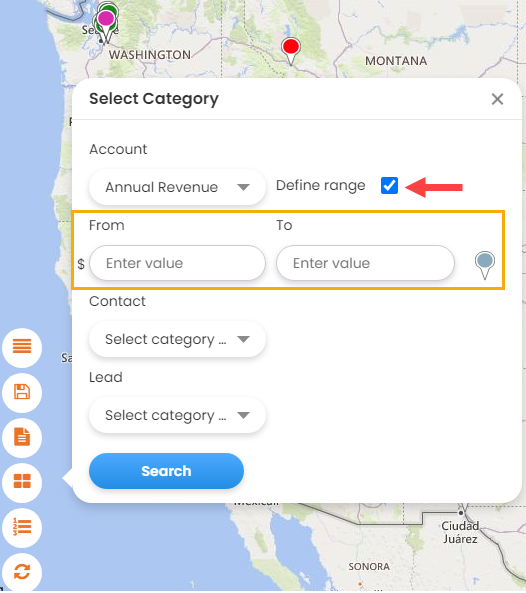
The sales manager wants to know the annual revenue of the Accounts. He can select Annual Revenue in the category search to plot data according to the annual revenue and check the revenue achieved yet.
You can also set the Range of the annual revenue and search the records as per the inserted numeric values. Click on the “Define Range” checkbox, you will get the “From” and “To” option where you can insert the Range.
For Contact:
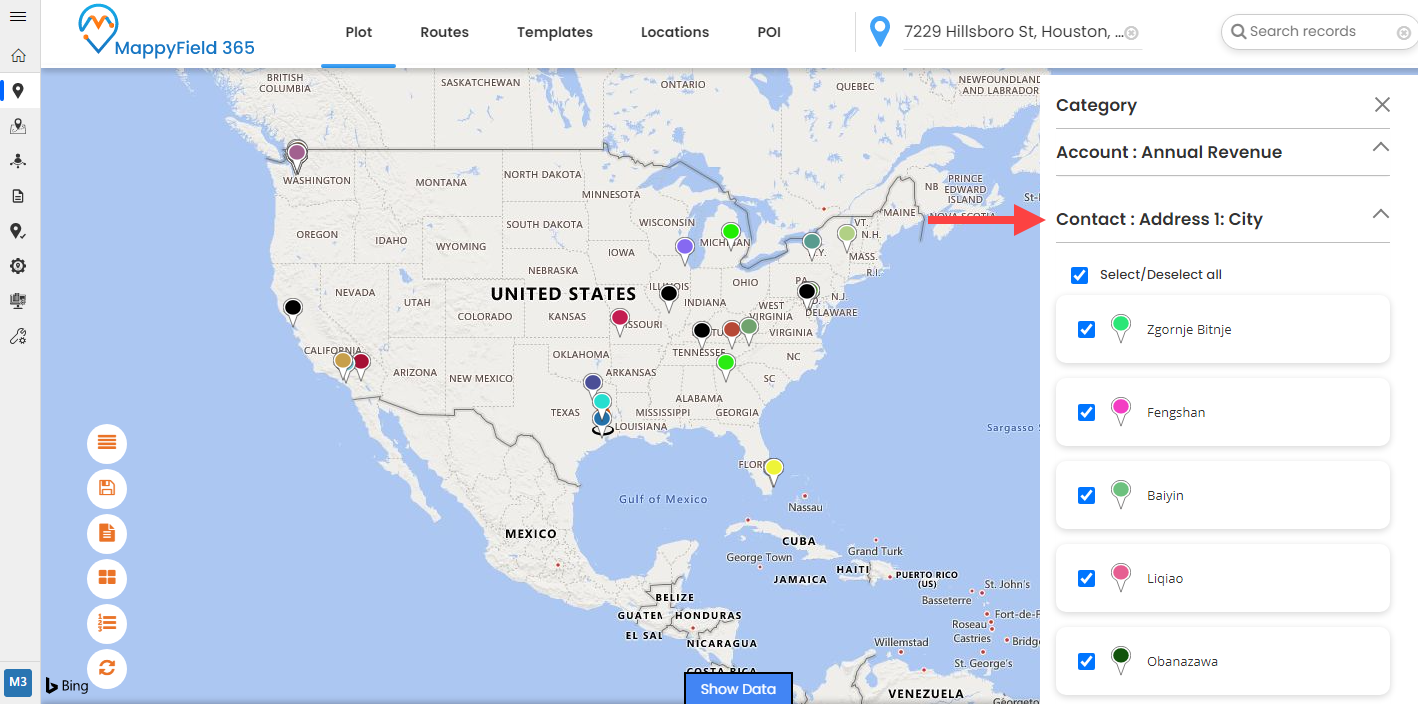
The sales manager can search the client’s location based on the field selection of the specific address or the city.
The City is selected as a field to see the location of the customers.
For Lead:
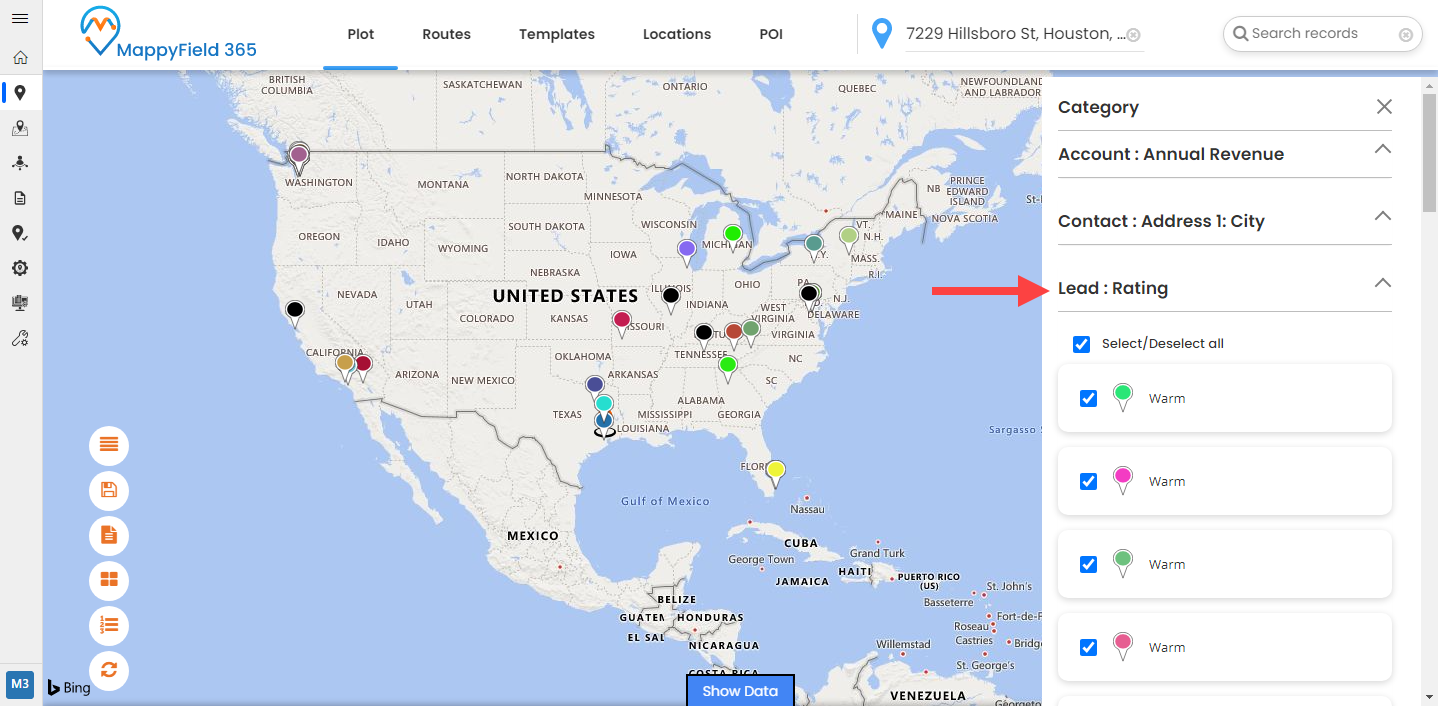
Based on the Leads’ type or ratings, the sales manager can plan the sales activities and fix the appointment or demo if required.
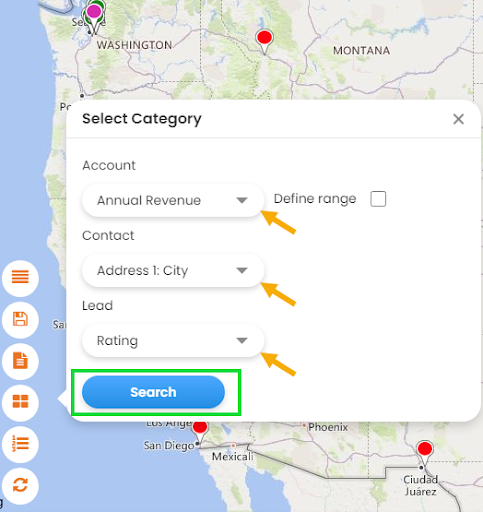
Click on the Search button; the categorized records are plotted on the map. On the right side, the “Category Card” slider will appear to see the results as per the entities and the categories selected.
For Accounts, the records will plot as per the selection of the Category “Annual Revenue.”
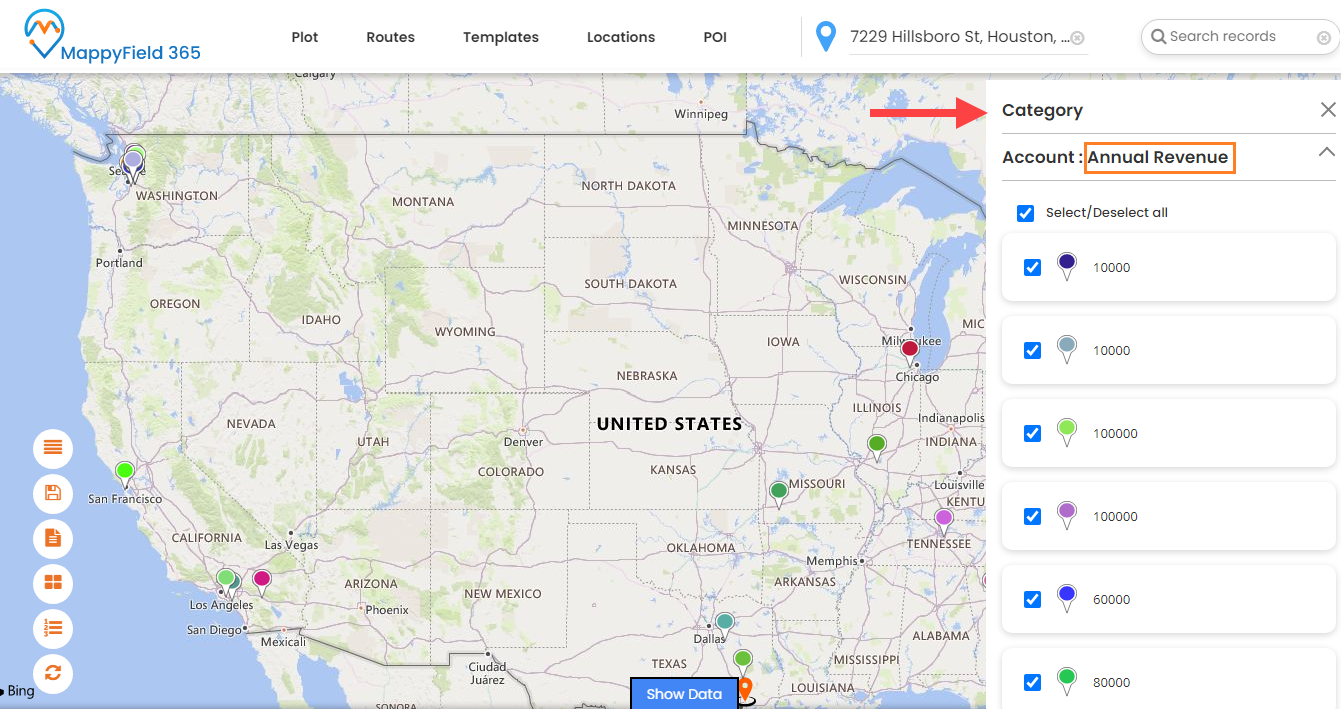
If you have added the “Range” for the Accounts to search the records between the added amount in the range, the records will plot as per the range.
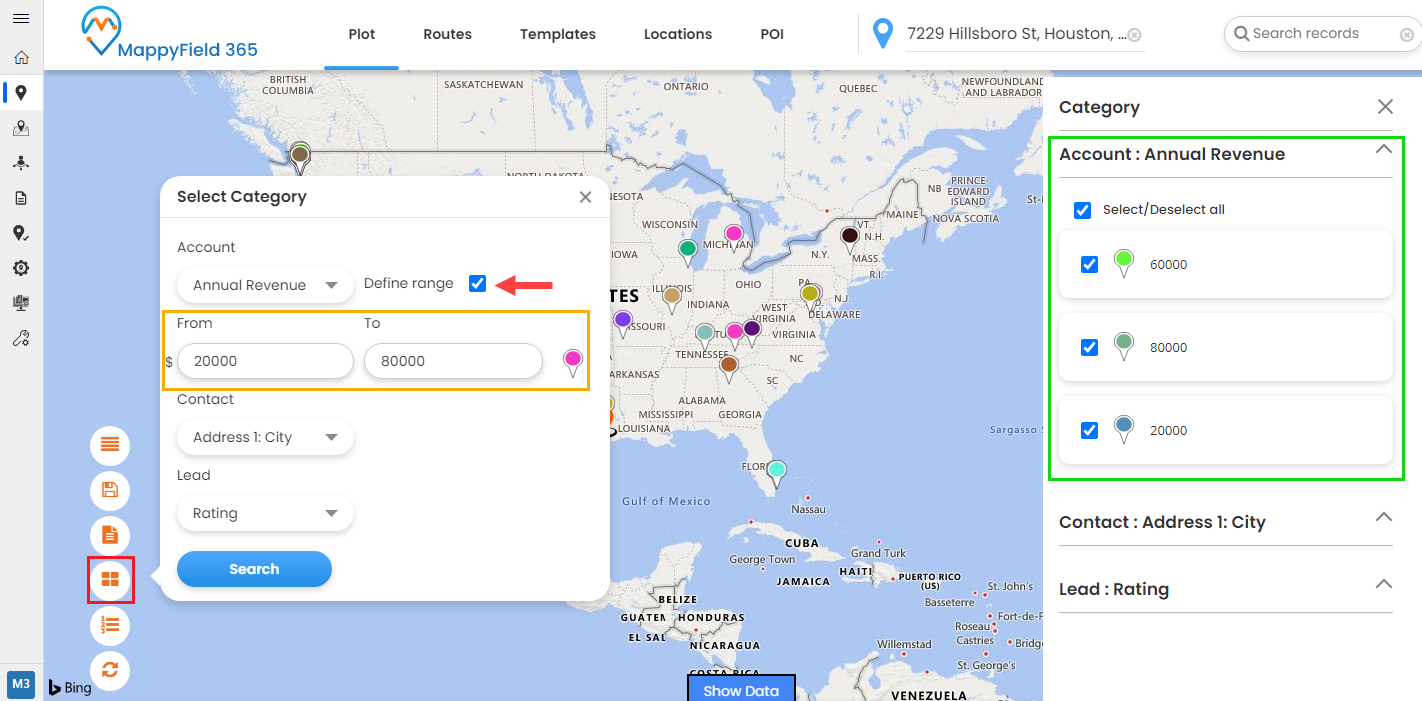
From the “Category Slider,” by scrolling down, you can see the record details for the “Contact” & “Lead” as well.
For Contact, it will plot the records as per the selection of the category: “Address 1: City”.
For Lead, it will plot the records as per the selection of the Category: “Ratings.”
Step 4: Entity and labels from Layer Card
Once the categorized records are plotted, you can enable/disable the entities and show/hide the entity records labels on the map from the “Layer Card.”
By disabling any entity (left-button), the entity will not appear on the map until you enable it. By clicking on the show/hide icon (eye icon), the labels of the entity records will show.
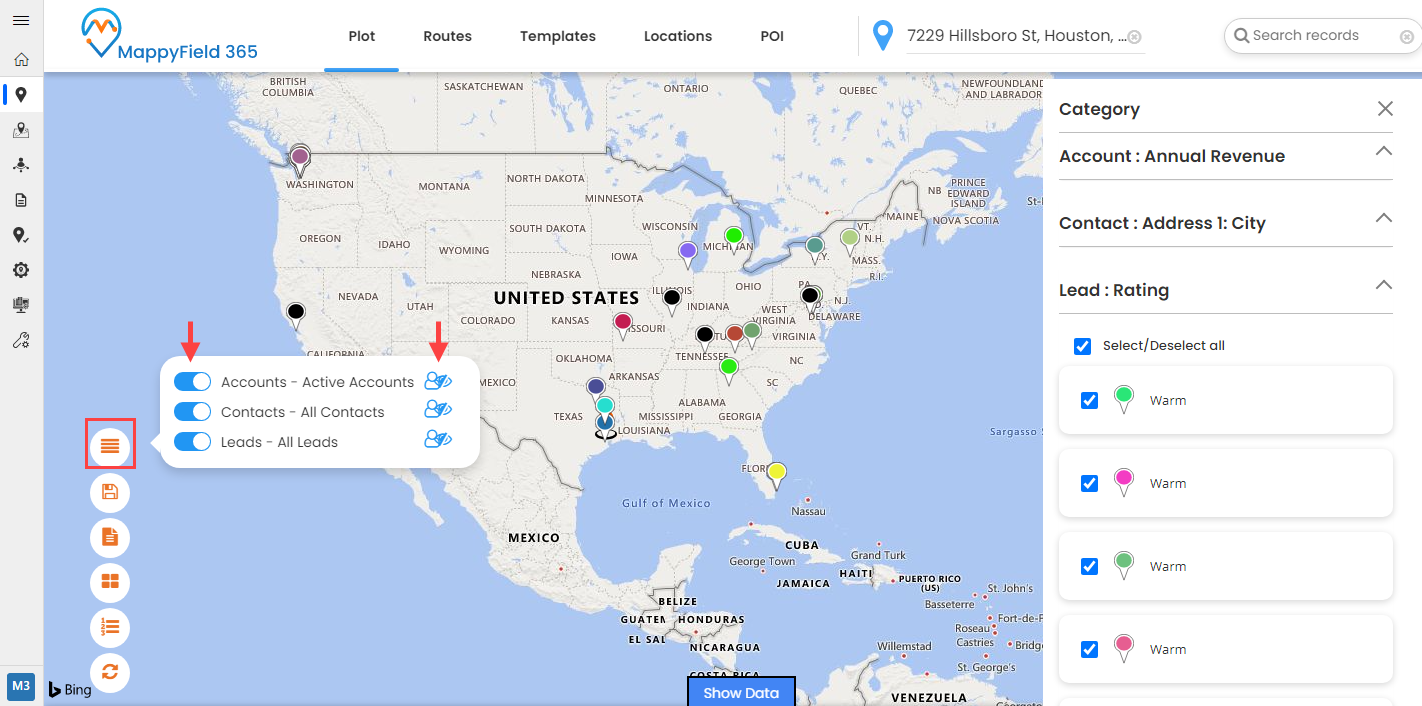
So from the “Layer Card,” you can disable other entities that are not needed right now for a while, and you can show the labels of the entity records to search for a specific record.
In this way, you can plot the multiple records of the different entities by selecting relevant categories and analyze the records from the Category Card slider.
If you are facing any issues with any feature, feel free to reach out to us at [email protected], or you can also tweet at us at @appjetty.
All product and company names are trademarks™, registered® or copyright© trademarks of their respective holders. Use of them does not imply any affiliation with or endorsement by them.


