As sales reps, if you’re spending more time on field, you probably know the importance of maps and how they help reach clients’ locations on time. However, like any other software, using Google Maps requires a trick. Because as easy as it sounds, it can be tricky to plot data for visualization.
Hence, this article explains how to plot data on Google Map using MappyField 365, the geo-analytical plugin of Microsoft Dynamics 365 CRM.
To plot data on Google Map:
1. First, add the entity by using an Entity to Map functionality, the same as the Bing Map.
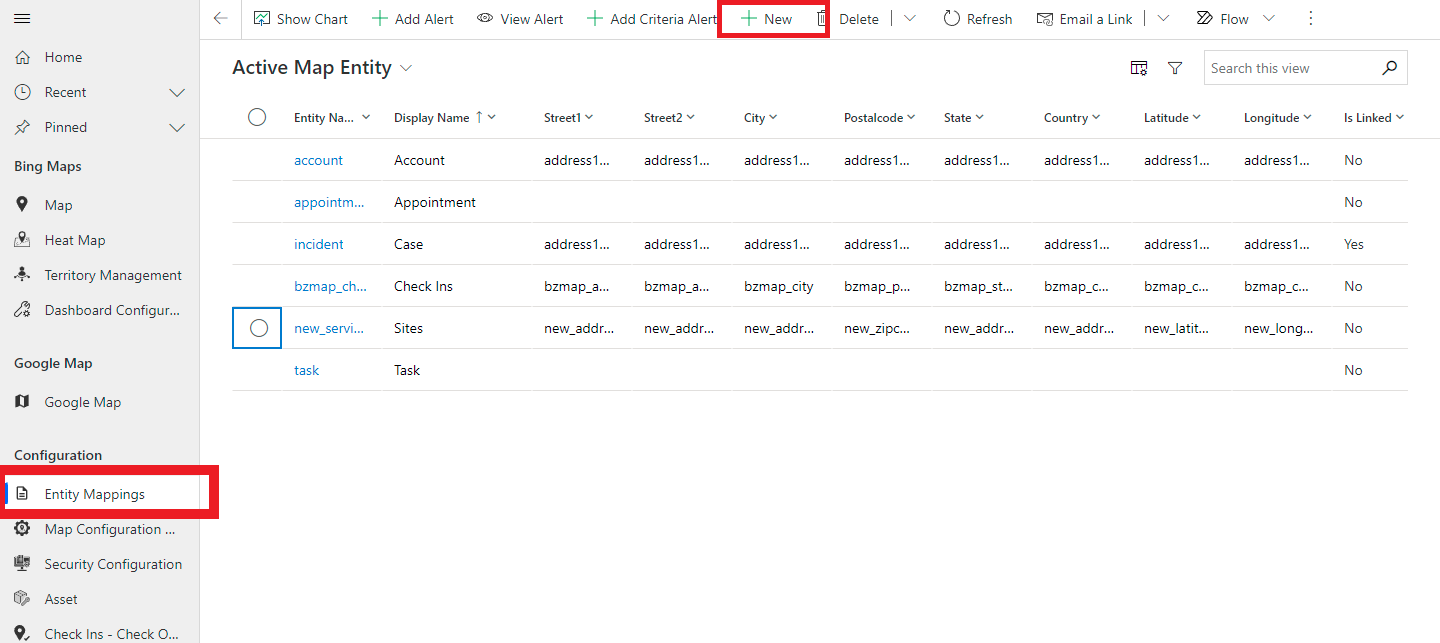
2. Go to the Entity Mapping tab on the left side and click on the New button.
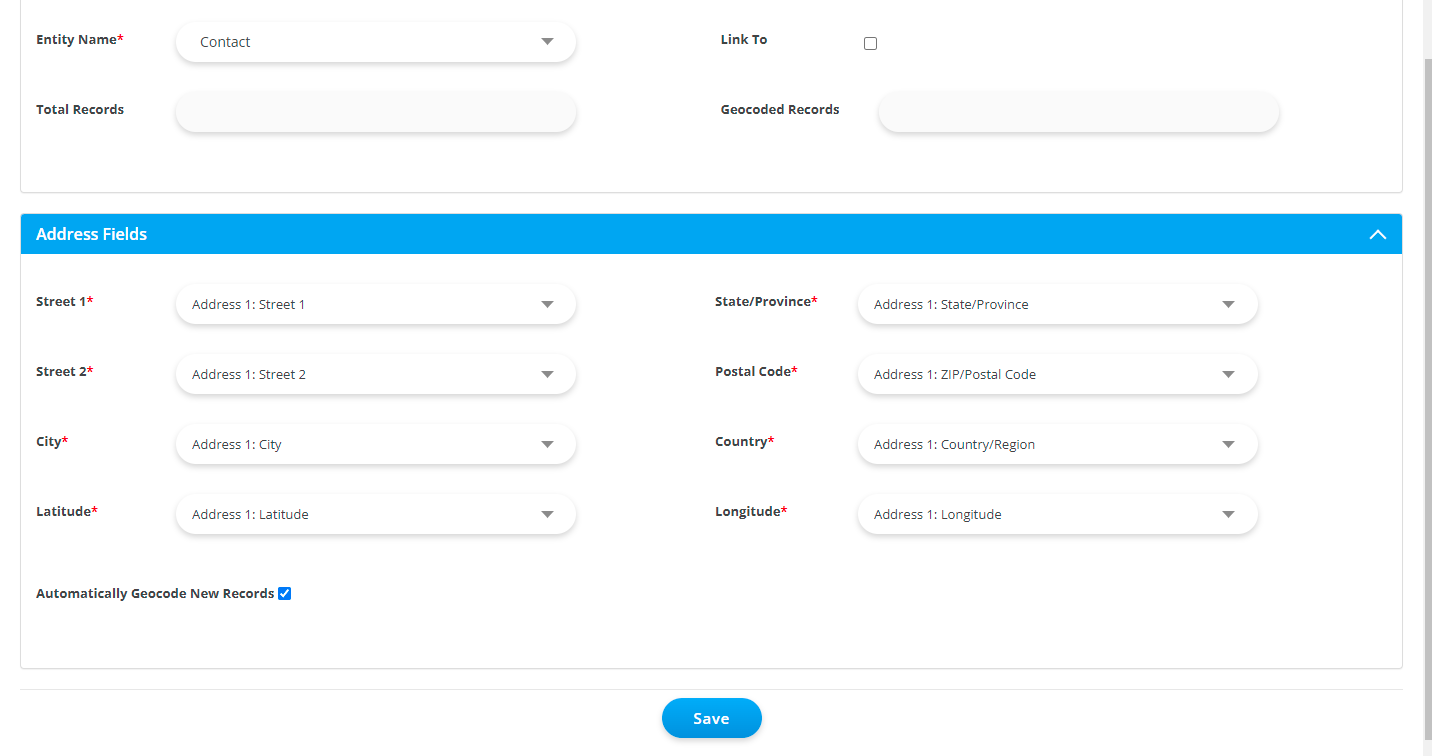
3. Select the entity that you want to view on the map.
4. Click on the Save button. You can set data grid attributes, data filter attributes, summary card attributes, tooltip attributes, and set view selection from Entity to Map Configuration.
Configure Data Grid Attribute
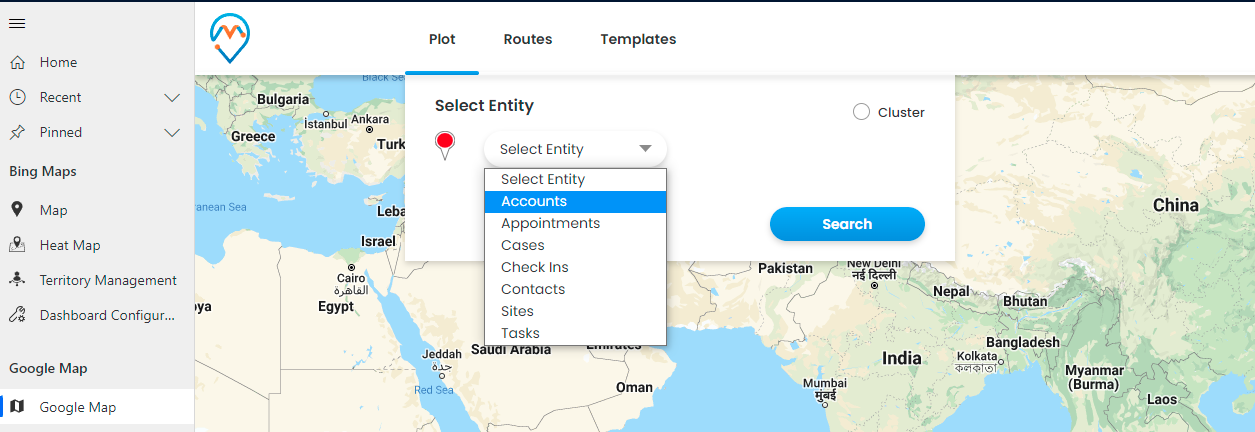
1. Go to the Google Map page and select the entity from the Plot tab.
2. After selecting the entity, select the entity view and click on the Search button.
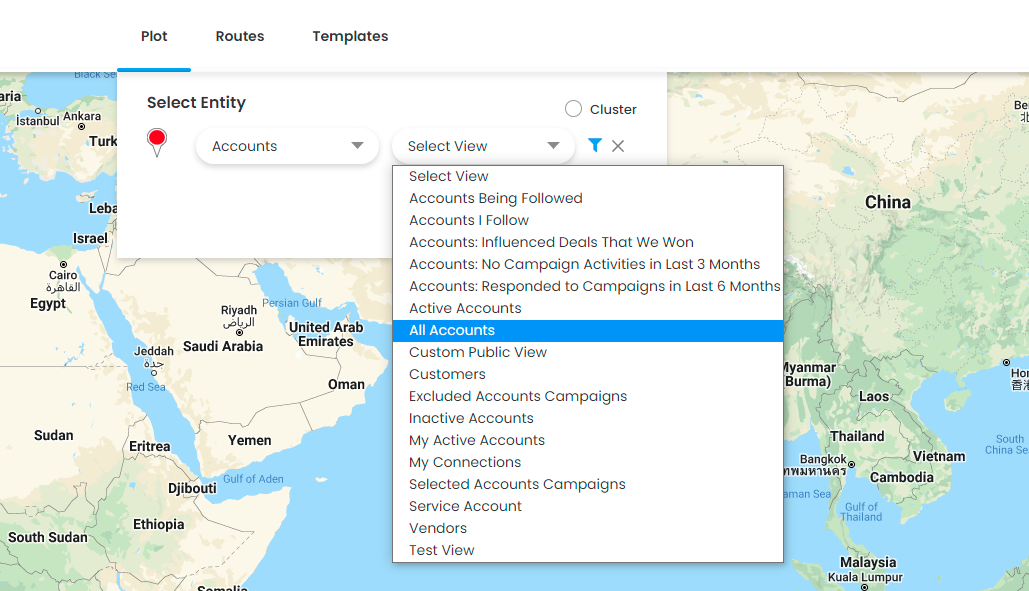
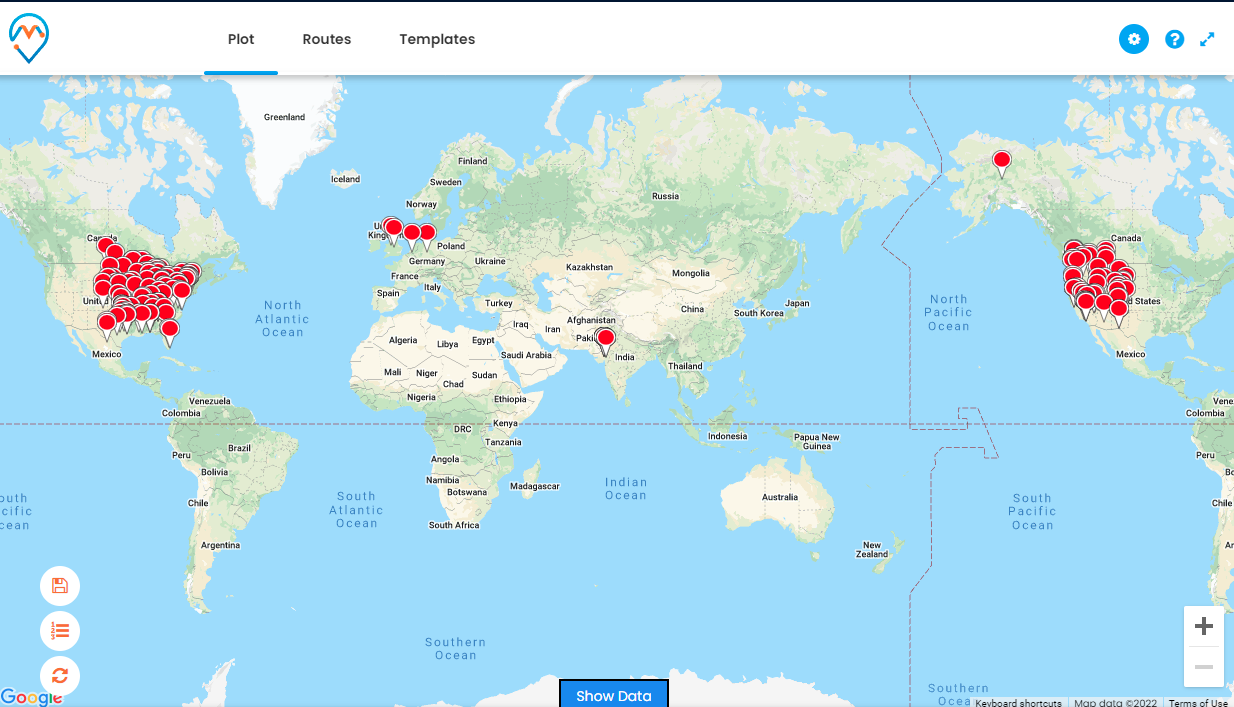
3. On selecting entity view, you can see all the plotted data on the map, as shown in the image below.
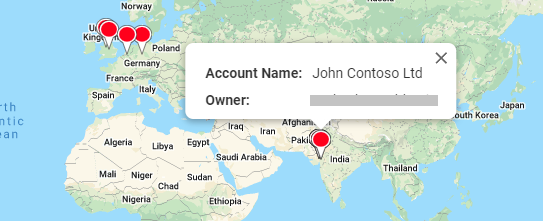
4. You can view the configured tooltip attributes details in entity mapping for a particular entity on hover.
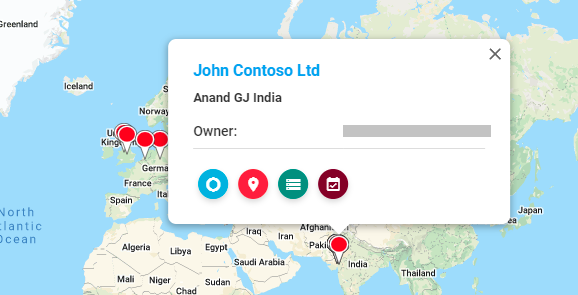
5. You can see the profile pop-up on pin click as shown in the below image.
That’s it!
It’s not that tricky, right? Well, that’s the forte of Dynamics 365 Map. It helps businesses visualize CRM data and perform all the sales activities directly from map.
All product and company names are trademarks™, registered® or copyright© trademarks of their respective holders. Use of them does not imply any affiliation with or endorsement by them.


