With data scattered in many places and formats, it has become difficult to make fast, wise decisions in today’s business world.
For Dynamics 365 users, both big data sorting and data visualization tools can greatly improve their customers’ overall understanding. If you can easily view all the accounts, contacts, and leads in one easy-to-use location, you can visualize your current and potential customer base.
The same data can go a long way in a map view if only because it is easier to analyze it, find trends, and make decisions on the spot. A useful feature of Dynamics 365 for plotting Entity Records directly on a map is also provided.
With this capability, users can see at a glance where customers, leads, and other important contacts are. In this blog, we will demonstrate how to use Custom Mapping functionality in Dynamics 365 to manage and make your data meaningful.
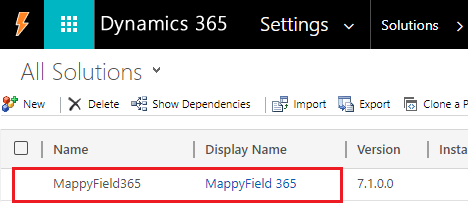
Step 1: Import the package of MappyField 365 and install it.
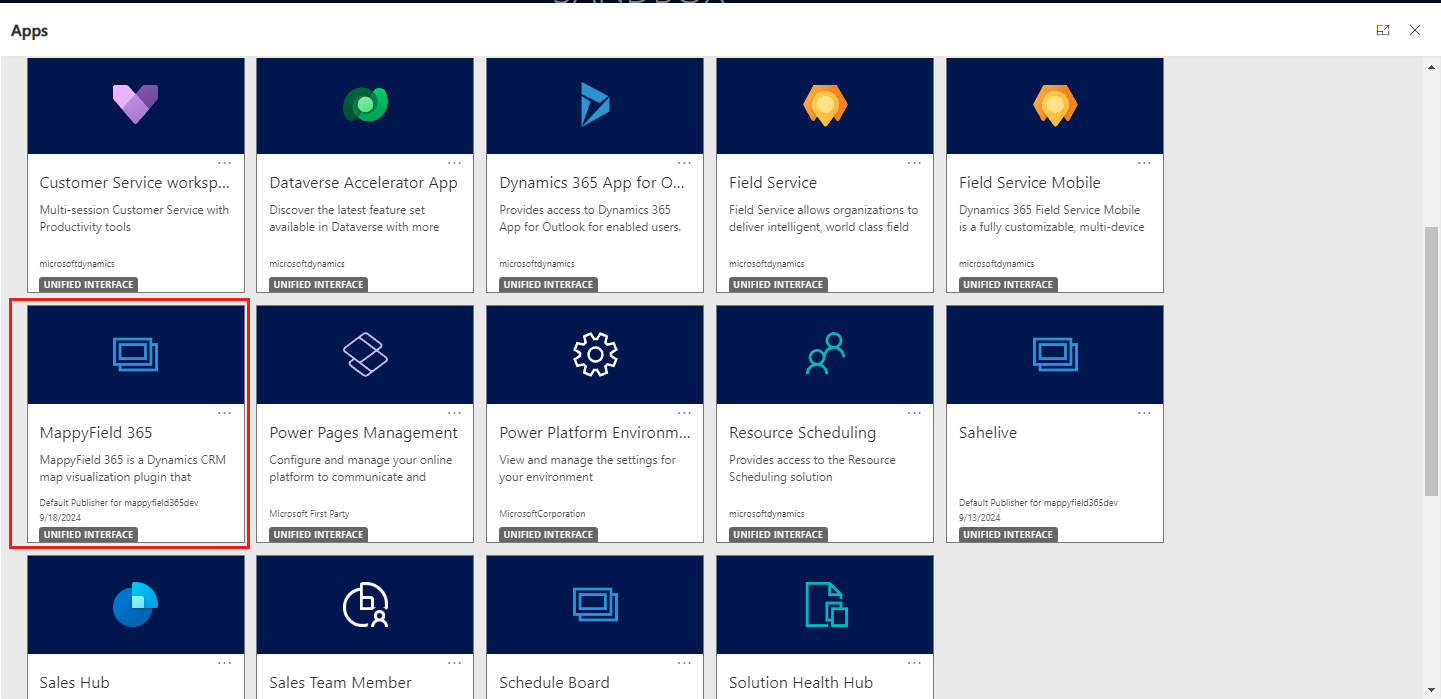
Step 2: Navigate to “MappyField” from the apps menu
Once you’re logged into Dynamics 365, select “MappyField 365” from the app’s dashboard.
Step 3: Click on Entity Mappings
Go to the Entity Mapping section to configure the entity details that will appear on the map.
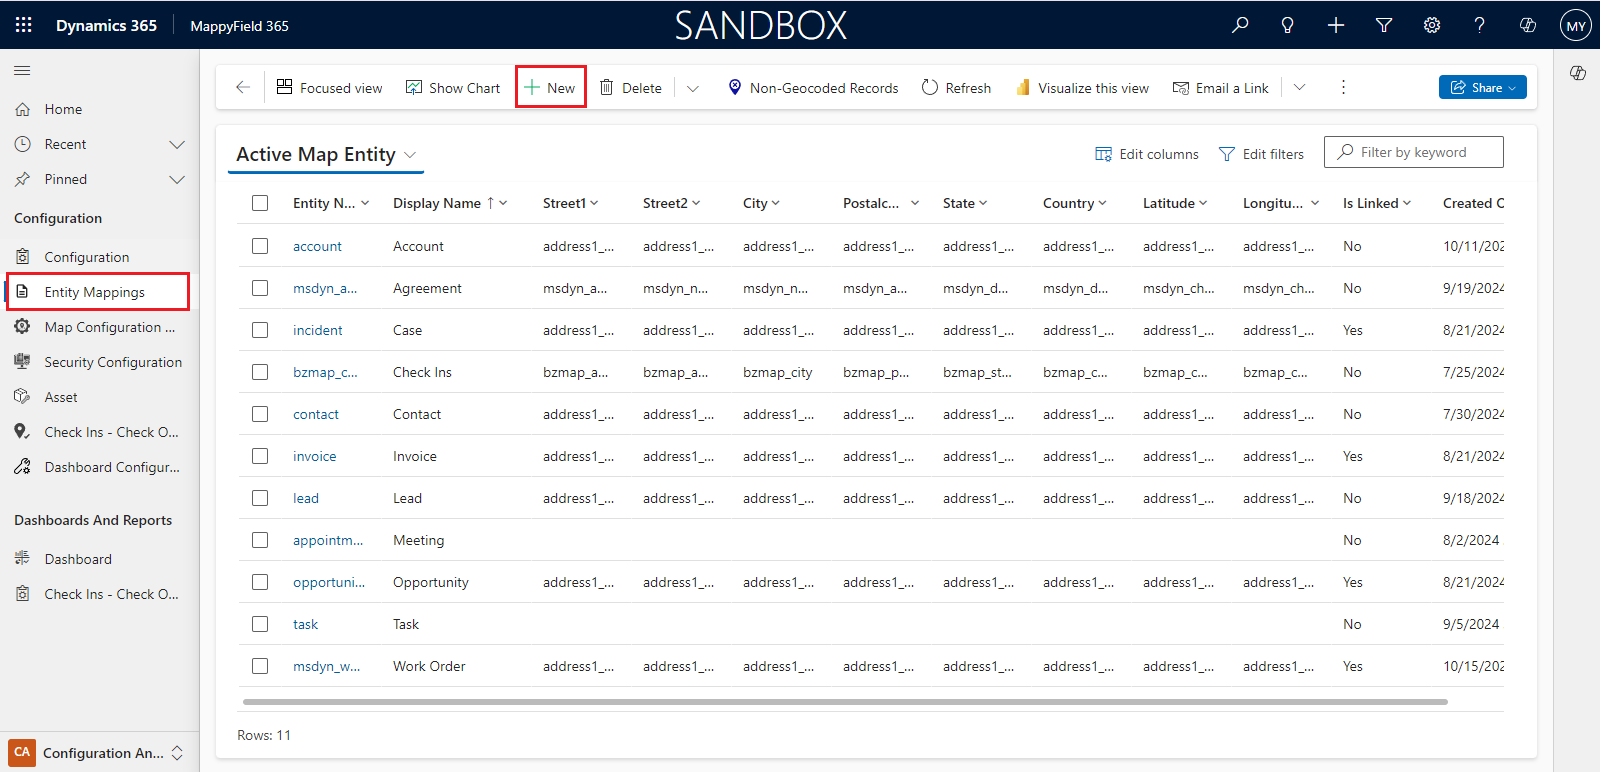
→ Click the “New” button to create and set up a new entity.
→ Next, choose an entity from the “Entity Name” dropdown and configure the address fields for it.
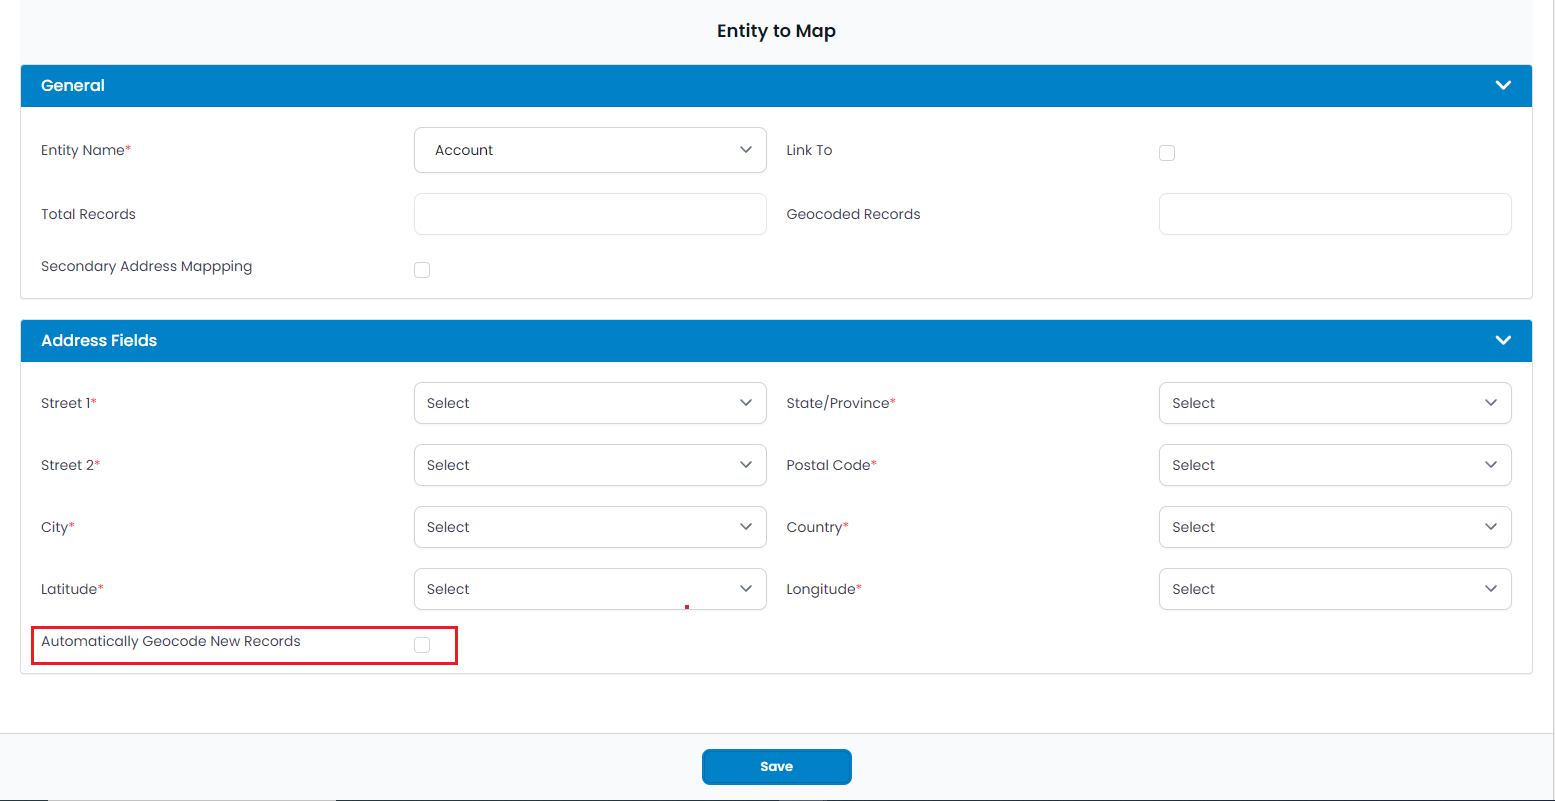
→ Check the checkbox “Automatically Geocode New Records” to automatically generate geocodes when new records for configured entities are created.
→ Click on the Save button to save entity configurations.
Step 4: Get Geocodes for entity records
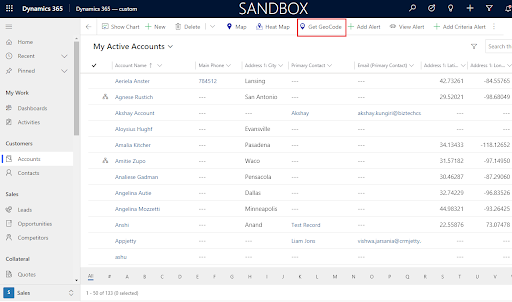
Step 5: Plot records on MappyField 365 map
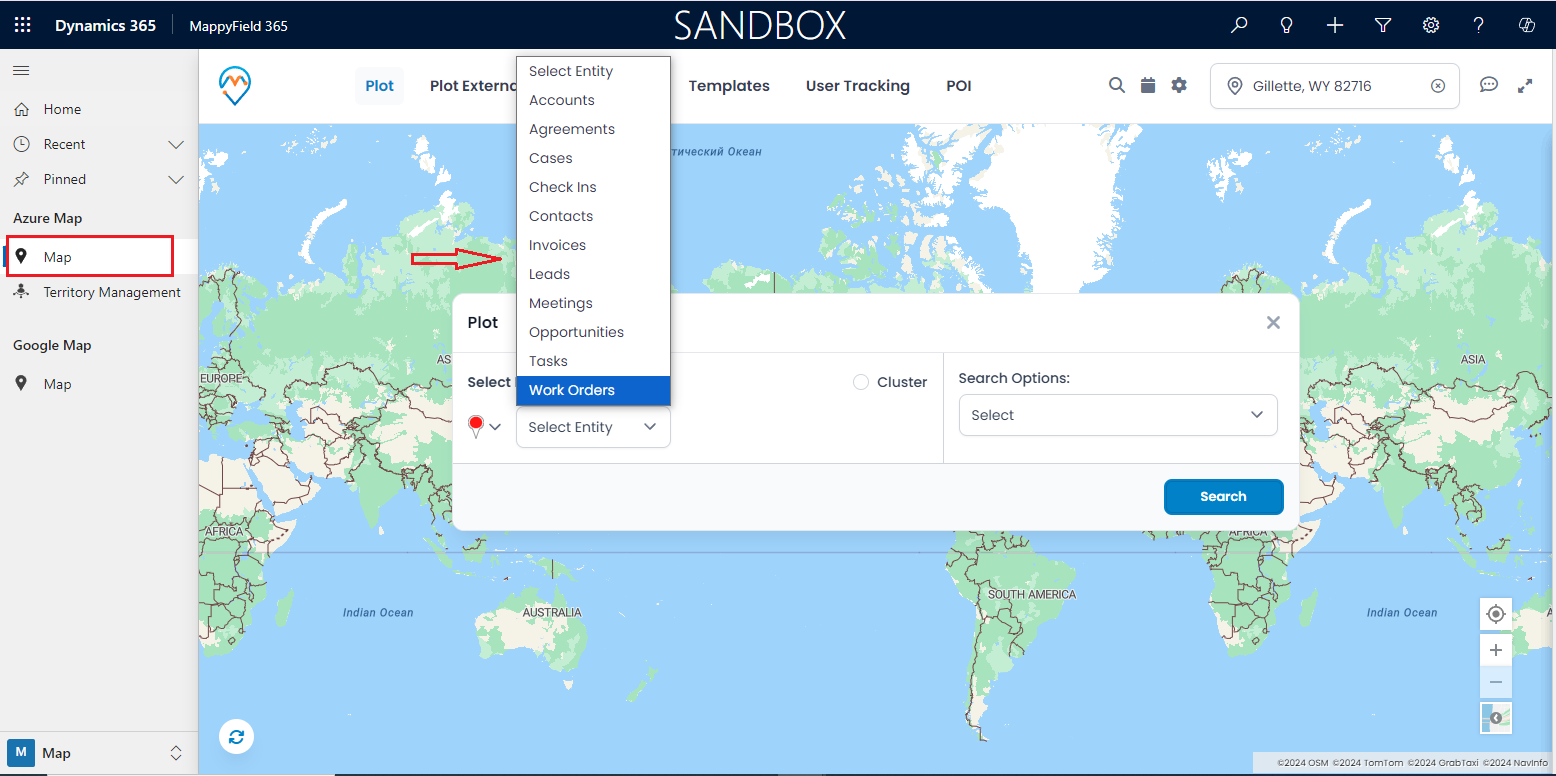
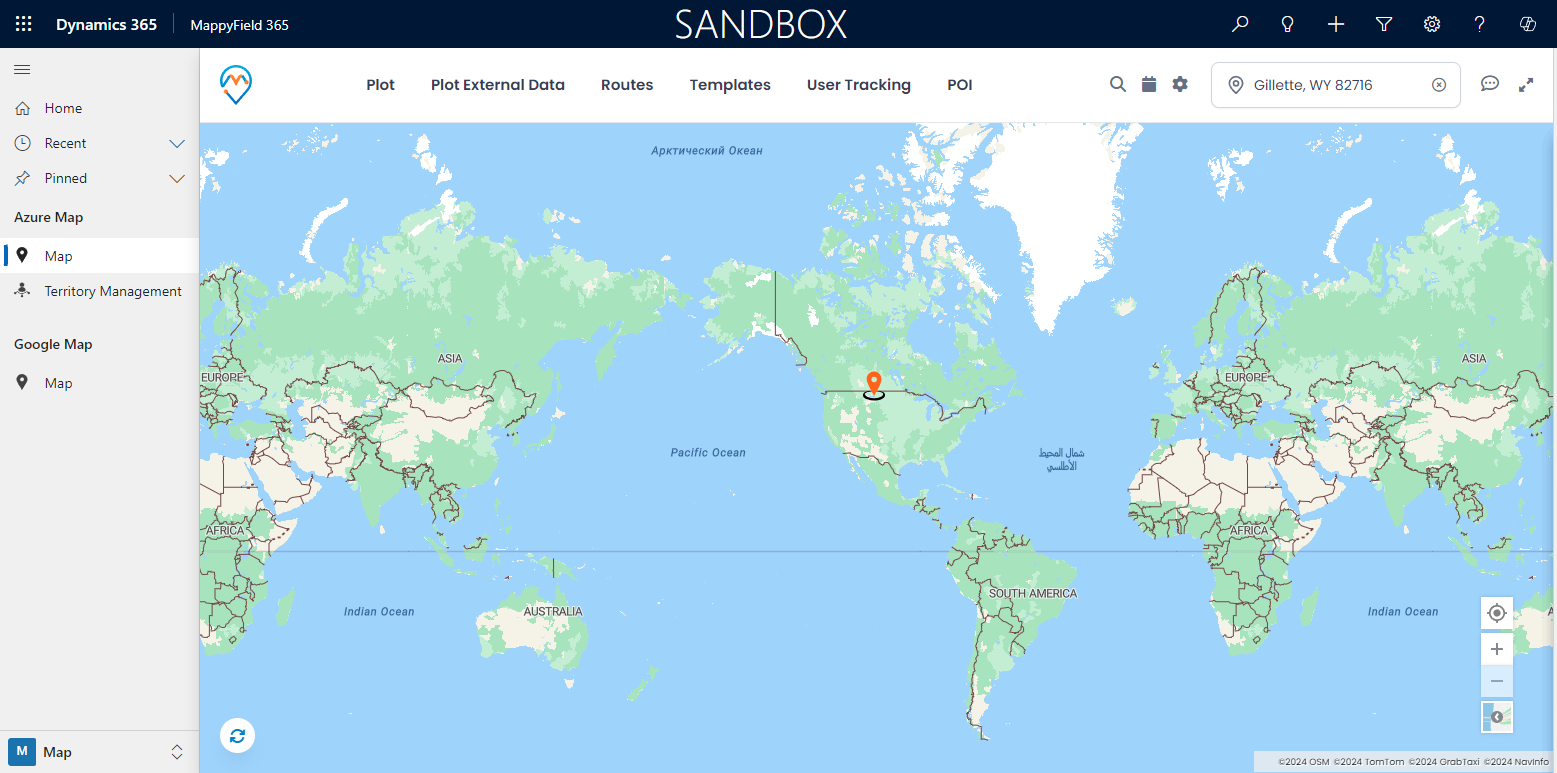
Clicking on “Map” will load the map view according to the admin’s default location settings.
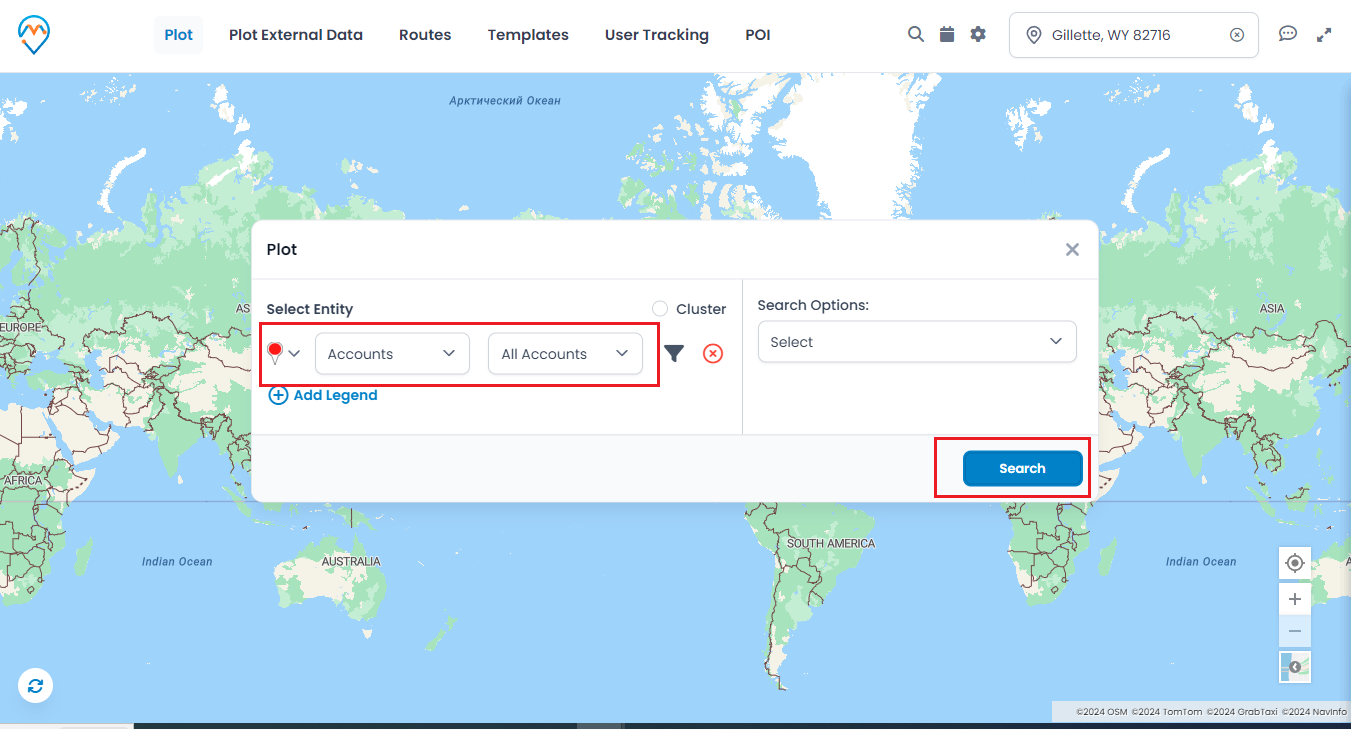
→ Under the Plot Records, select the Entity from the “Select Entity” drop-down to plot the records on the map.

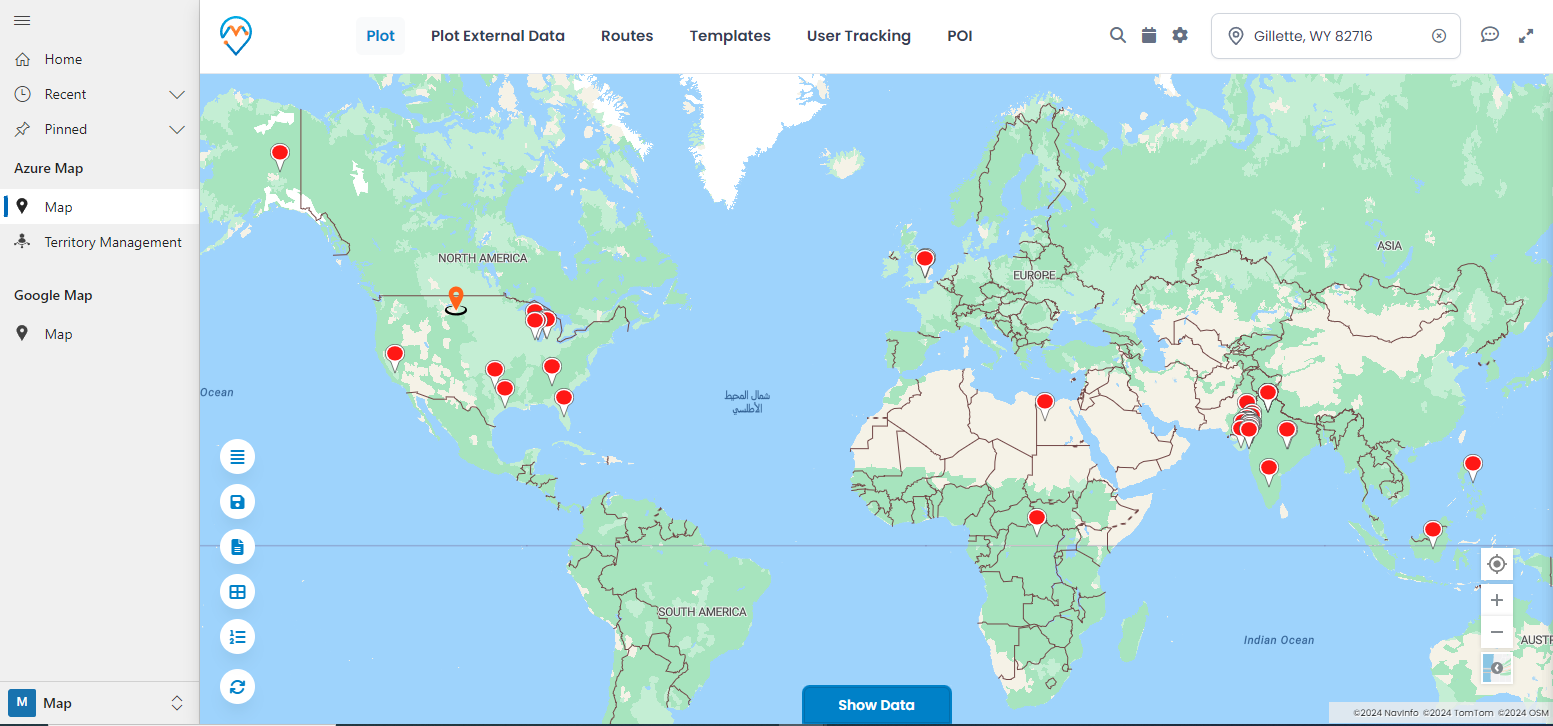
→ Based on your chosen entity and related options, records for that entity will be displayed on the map. For example, if you select “Accounts,” you can then choose an attribute to display on the map using the view options next to the entity selection. You can also select a specific view for Accounts, such as “All Accounts,” “My Active Accounts,” “Inactive Accounts,” and so on.
→ The account details can be seen by clicking on a Pin icon.
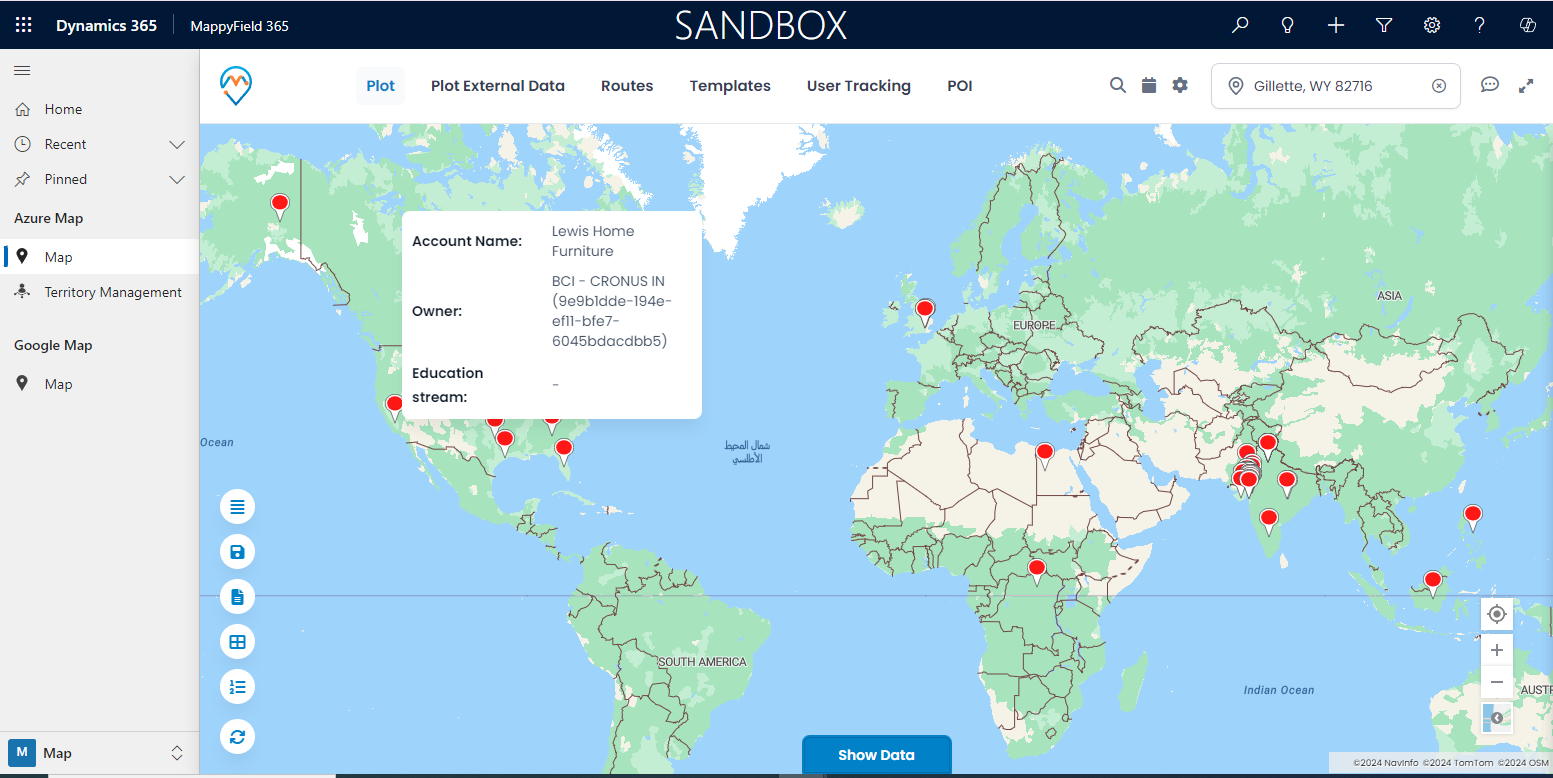
→ Check the record details by moving the mouse on the pushpin icon.
→ In MappyField 365, you can also plot records for multiple entities. To do this, click on ‘+Add Legend’ and choose the entities you want to include. Then, select each entity along with its specific record view options.
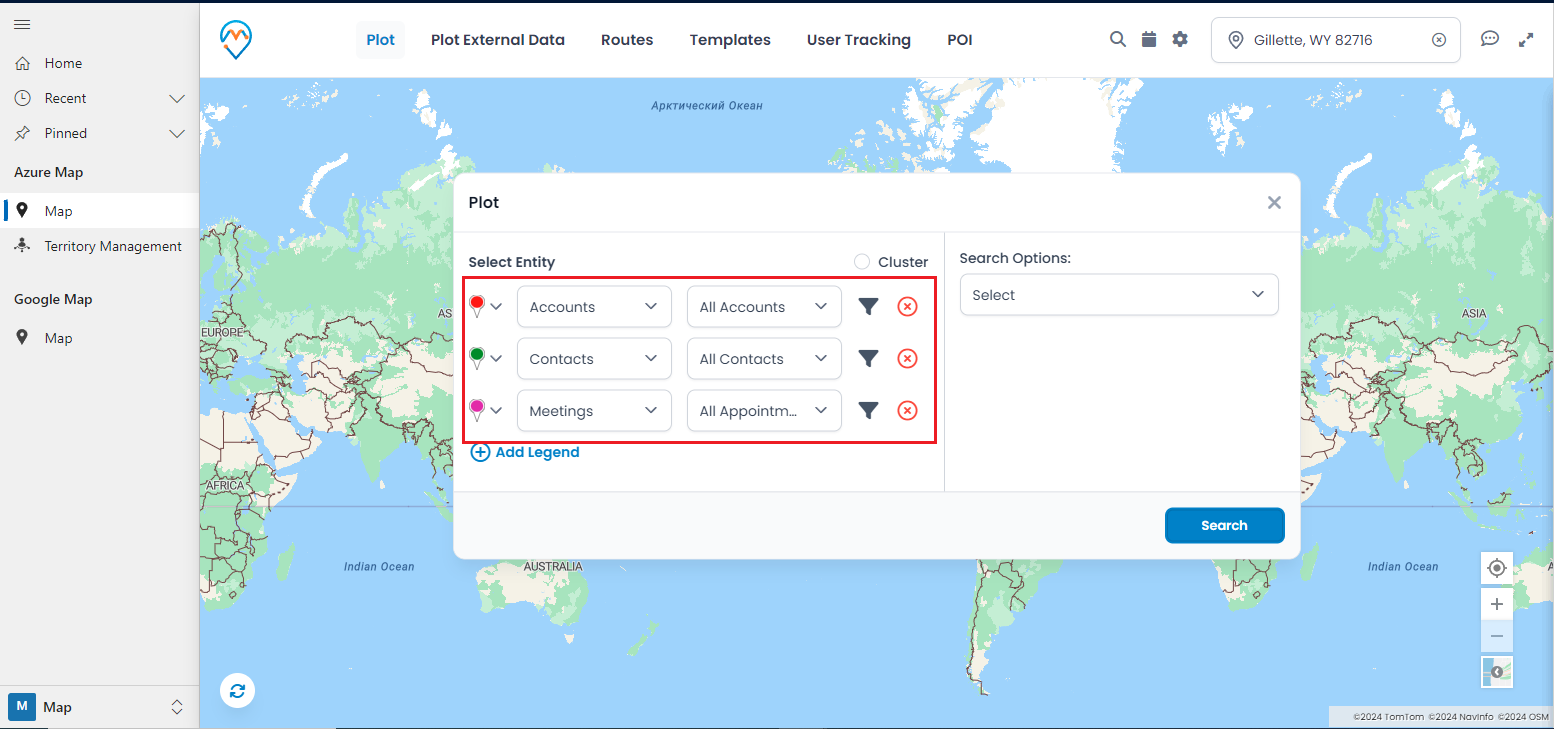
→ By clicking on the Search button, the selected entity with the record view will be plotted on the map.
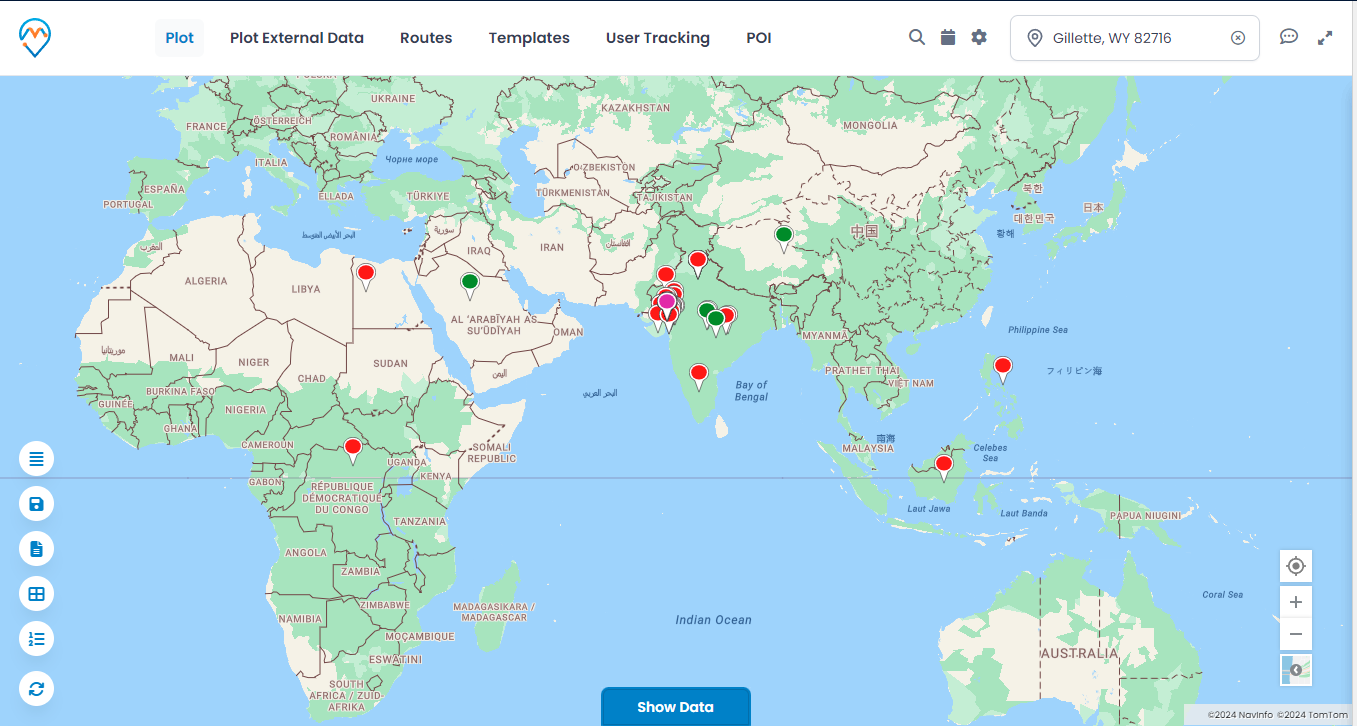
By following these steps, you can seamlessly add and configure entities to display CRM records on a map using Dynamics Map Integration, MappyField365. This powerful tool makes it easier than ever to visualize your data and gain location-based insights directly from your Dynamics CRM.
All product and company names are trademarks™, registered® or copyright© trademarks of their respective holders. Use of them does not imply any affiliation with or endorsement by them.


