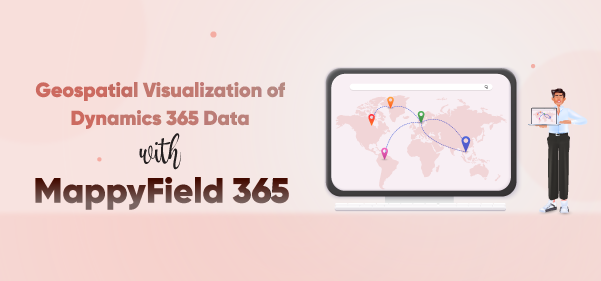
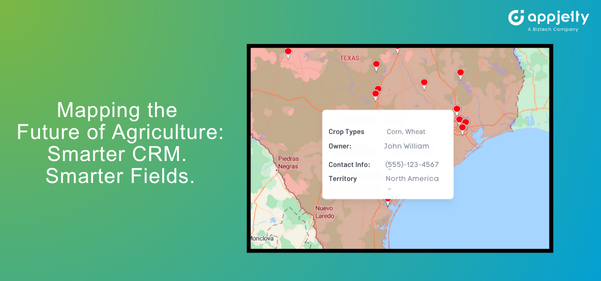
CRM data plotted on a map can give you the ‘where’ along with the ‘who’ and the ‘what.’
A lot of businesses approach us searching for a solution on how they can add latitude and longitude coordinates to accounts.
Well, the answer to all their queries is MappyField 365.
In this blog, we will learn how MappyField 365 transforms data to insightful maps and the benefits associated with it.
Understanding Geospatial Visualization
Geospatial visualization means the representation of data on maps. However, when paired with MappyField 365, it becomes so much more than just mapping data. It becomes a powerful tool that allows businesses to see, understand, and interpret their CRM data like never before.
The geospatial visualization feature in Dynamics 365 map takes latitude and longitude fields from your CRM data and plots them onto a dynamic, interactive map.
This feature enables businesses to see patterns, concentrations, and gaps in their market that might go unnoticed otherwise. It also empowers sales, marketing, and service teams to strategize effectively and allocate resources efficiently.
Benefits of Geospatial Visualization
1. Improved Decision-Making:
With the power to visualize your customer data geographically, MappyField 365 offers you a bird’s-eye view of your market landscape. You can easily spot customer patterns, identify areas of high concentration or untapped potential, and make decisions based on these insights. It’s like having a strategic advisor who provides you with accurate, up-to-date, and visually engaging data to make informed decisions.
2. Spatial Analysis
MappyField 365 can help managers and sales representatives in different ways:
- Proximity Searches: Search client locations around your current location for quick visits.
- Territory Management: Create and assign territories based on geographic data to streamline operations and responsibilities.
- Route Optimization: Help your sales representatives with optimized routes so that they reach their appointment locations on time.
3. Data Segmentation
MappyField 365 allows geo-segmented data handling where you can classify your Dynamics 365 data geographically. It helps with targeted marketing drives, resource allocation, and territory optimization.
Moreover, it helps you analyze customer behavior. Having a geographical point of view can provide unique insights into regional customer preferences and behaviors. Designing marketing campaigns with proper data increases its rate of success.
Conclusion
The geospatial visualization provides businesses with a powerful new lens to view, understand, and interact with their customer data. Plotting data based on its latitudes and longitudes unlocks a world of potential for better decision-making, increased efficiency, significant time savings, and enhanced accuracy. If you find this aspect of MappyField 365 interesting, let’s connect over a call. Our team will share with you other sides of MappyField 365 that can help you transform your business operations.
All product and company names are trademarks™, registered® or copyright© trademarks of their respective holders. Use of them does not imply any affiliation with or endorsement by them.


