

As a manager overseeing sales/marketing activities, I find it crucial to manage sales representatives and field executives effectively. You must assign territories and activities to achieve sales targets. Microsoft Dynamics 365 provides a geographic view of CRM records, which can be displayed on Dynamics 365 maps. You can enhance sales potential and revenue by creating territories for sales activities and market segments within Dynamics CRM/365.
While Dynamics 365’s default maps allow you to track CRM records on the map, they are limited to individual entities. You need to configure various backend settings within Dynamics CRM to track multiple entities and activities.
AppJetty MappyField 365 is a Dynamics CRM map integration plugin that helps plot CRM data on the map. With MappyField 365, CRM users can gain detailed insights into their market geography and prospect locations.
MappyField 365 offers Territory Management, which enables you to create and manage territories directly from the map. You can define areas and regions for sales and marketing activities using this feature. You can also import territory records into the map area by uploading a CSV file in a specific format. Furthermore, you can easily assign territories directly from the map to the relevant team members (Sales Reps).
In this blog, we will explain how to plot territories using a CSV file with the required format.
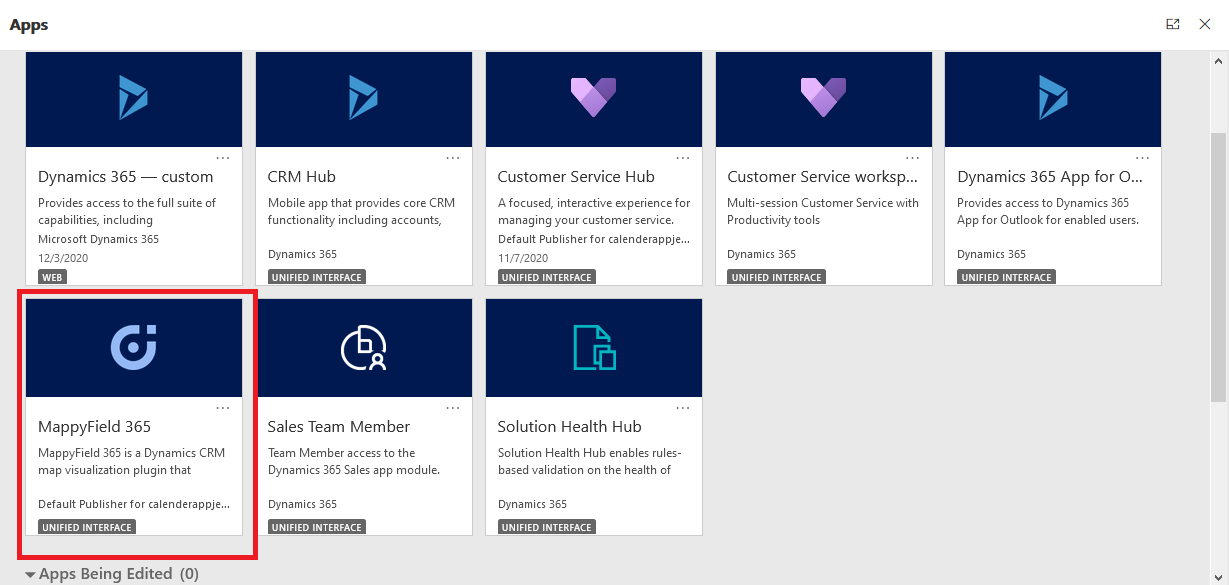
Step 1: Navigate to MappyField 365
Select ‘MappyField 365’ from the Dynamics 365 dashboard or app list.
By default, you will be directed to the ‘Map View’ of MappyField 365.
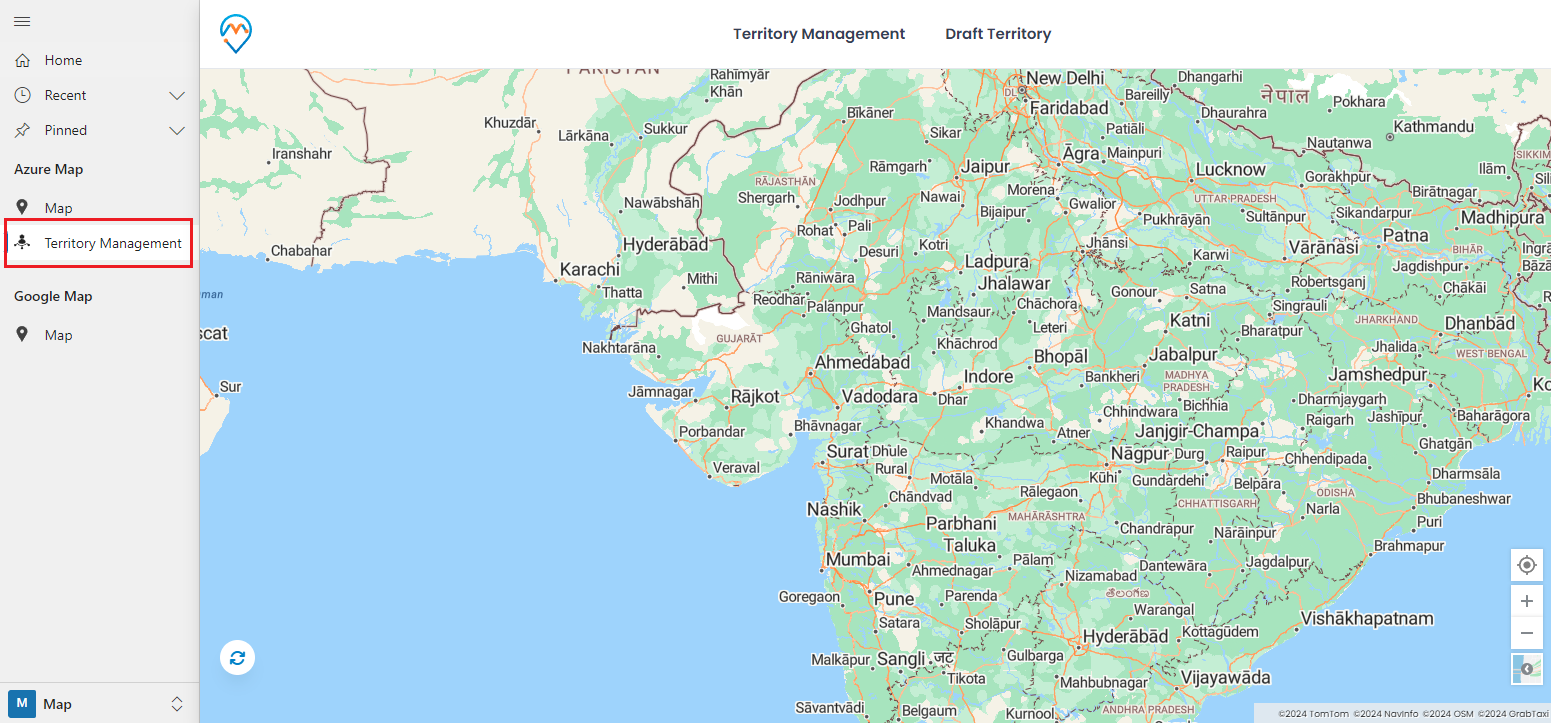
You can find Territory Management in the MappyField 365 navigation panel (on the left side) to create and manage territories.
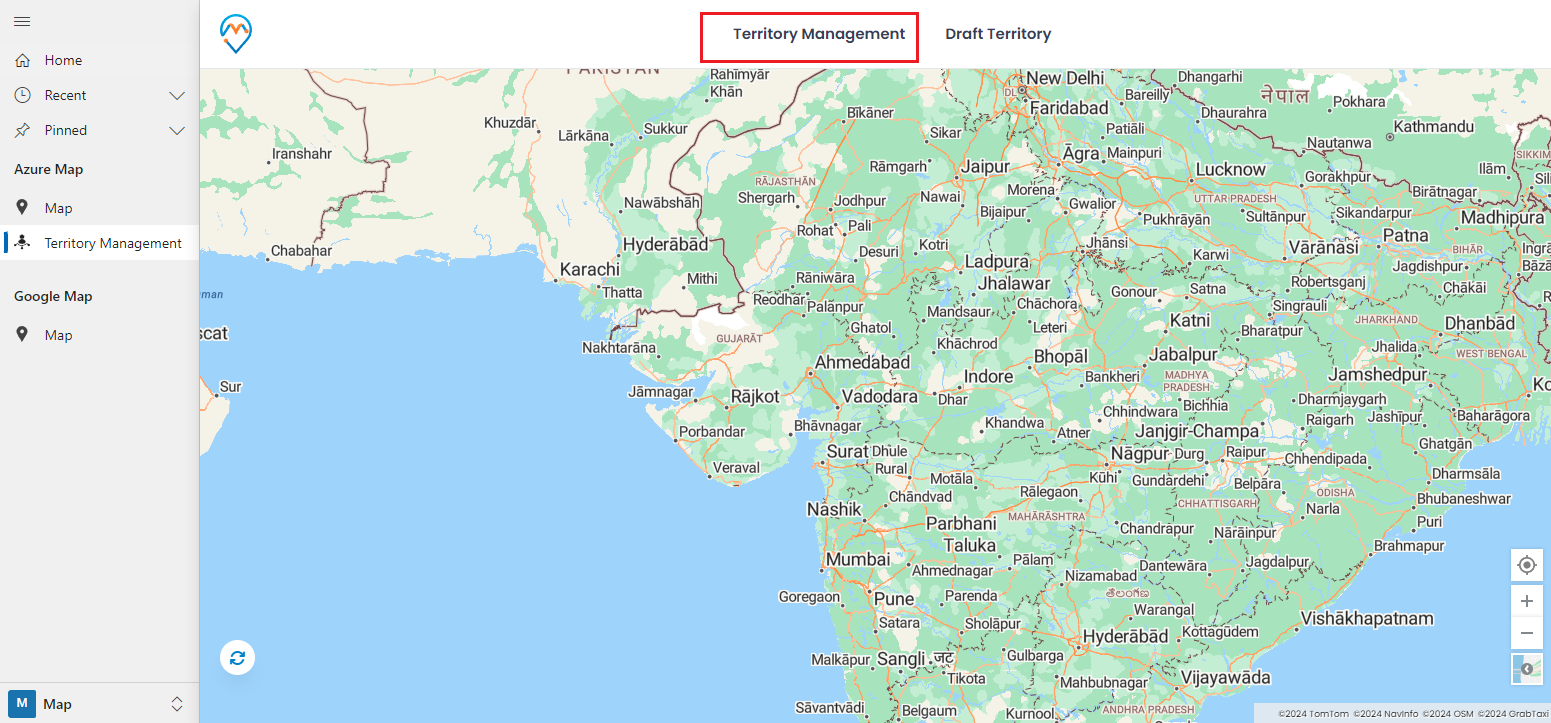
Step 2: Navigate to Territory Management
By clicking on ‘Territory Management,’ you will be navigated to the Territory Management map. From here, you can manage your sales areas as territories and assign the required team members (salespersons).
By clicking on ‘Territory Management,’ you will find the Search Options. You can create and manage the territories using By Region, By Drawing, By Territory (existing), and By File.
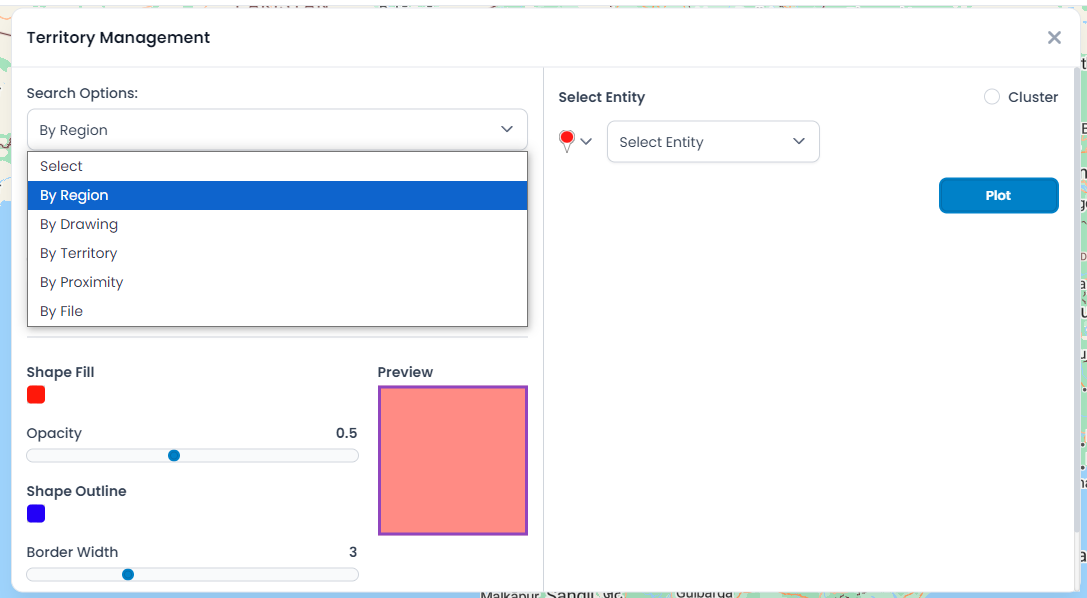
Step 3: Manage Territory By CSV File
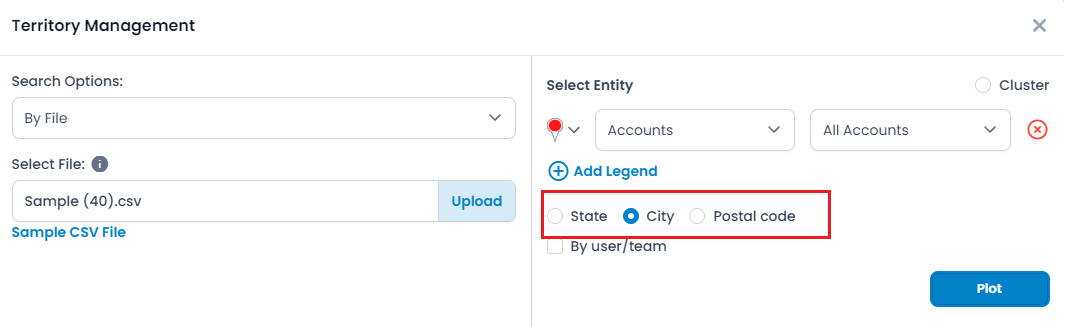
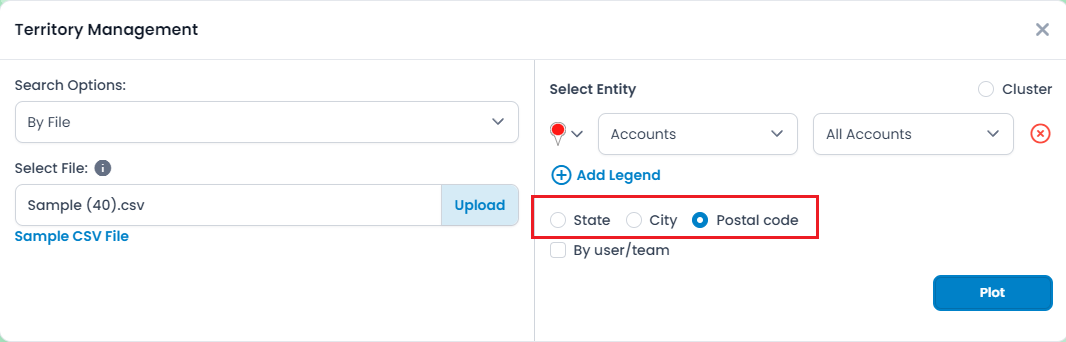
If you have a shapefile to manage the territories, you need to select the ‘By File’ option in the Search Options.
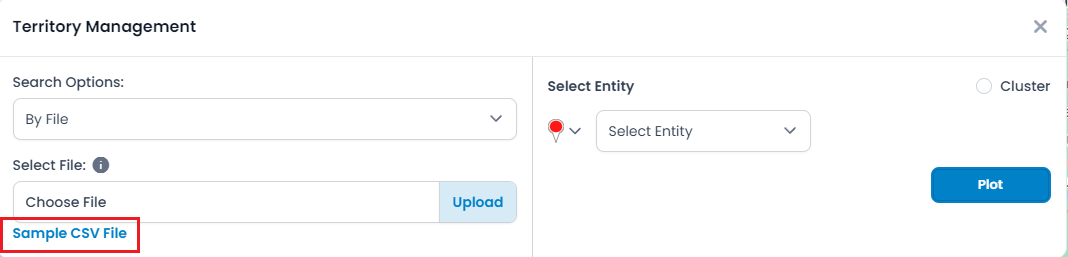
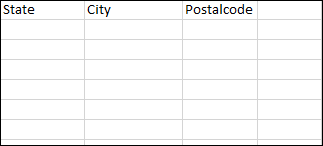
You need to upload a CSV file in a specific format. To understand the required format, download the sample CSV file by clicking on the “Sample CSV File” text caption. You need to enter the data according to this format. The CSV file will contain three columns: 1. State, 2. City, and 3. Postal Code.
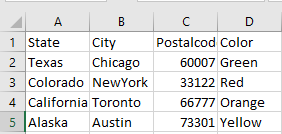
You can either enter the data manually or, if you have another CSV file for the area/region, make sure to format it according to the sample CSV file format.
After uploading the CSV file, you will see three options: ‘State’, ‘City’, and ‘Postal Code’. You need to select the option you want to plot on the map.
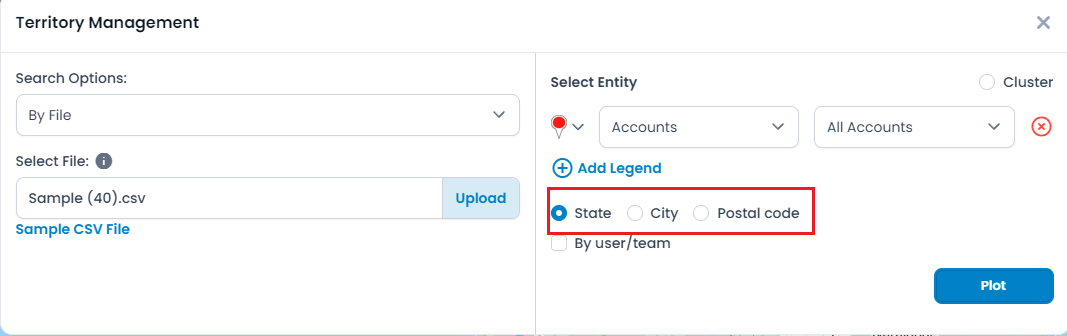
If you want to create the sales territories on the map based on the states, you need to select the ‘State’ and then click on the ‘Plot’ button.
Step 3.1: Select State
Once you select the ‘State,’ click on the ‘Plot’ button to add the geographical data to the map. You need to select the imported states from the data grid.”
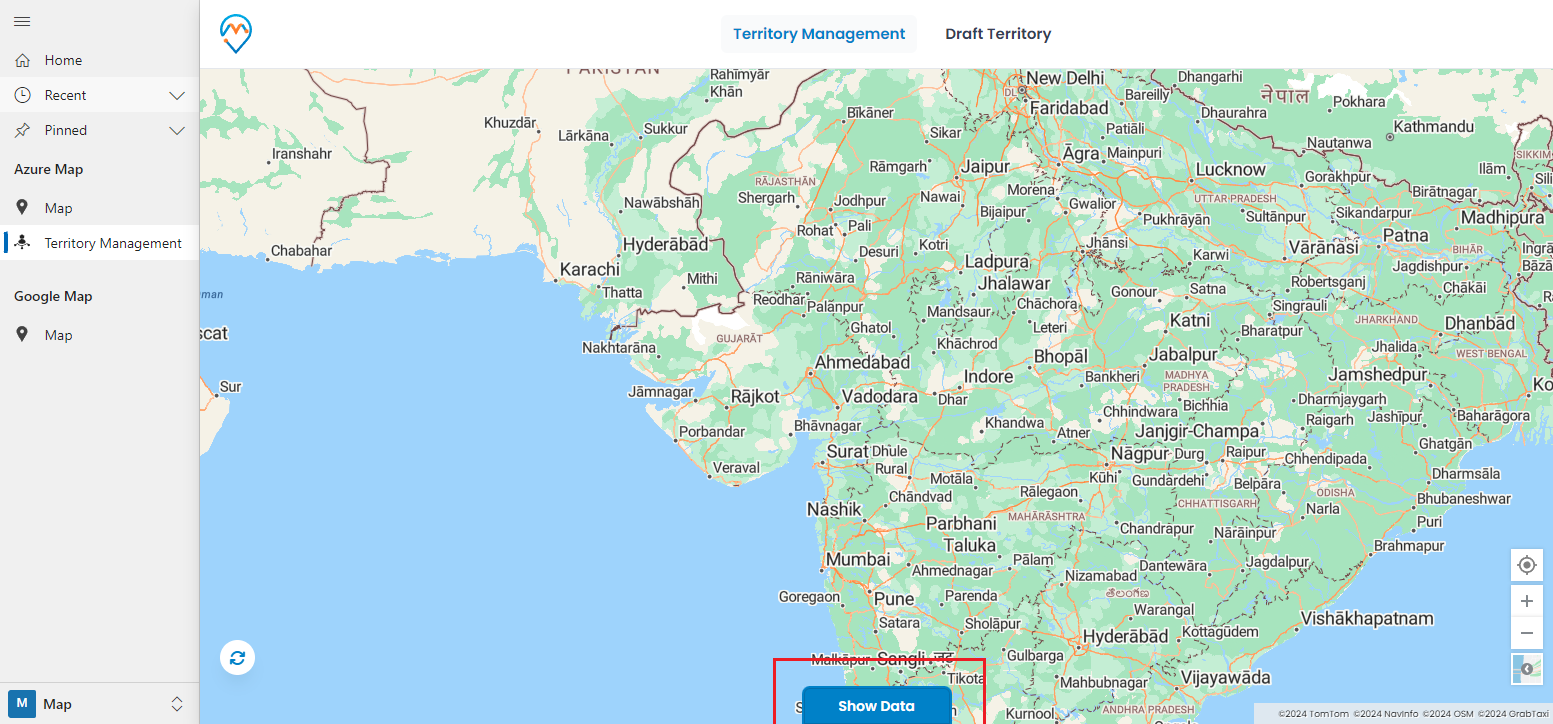
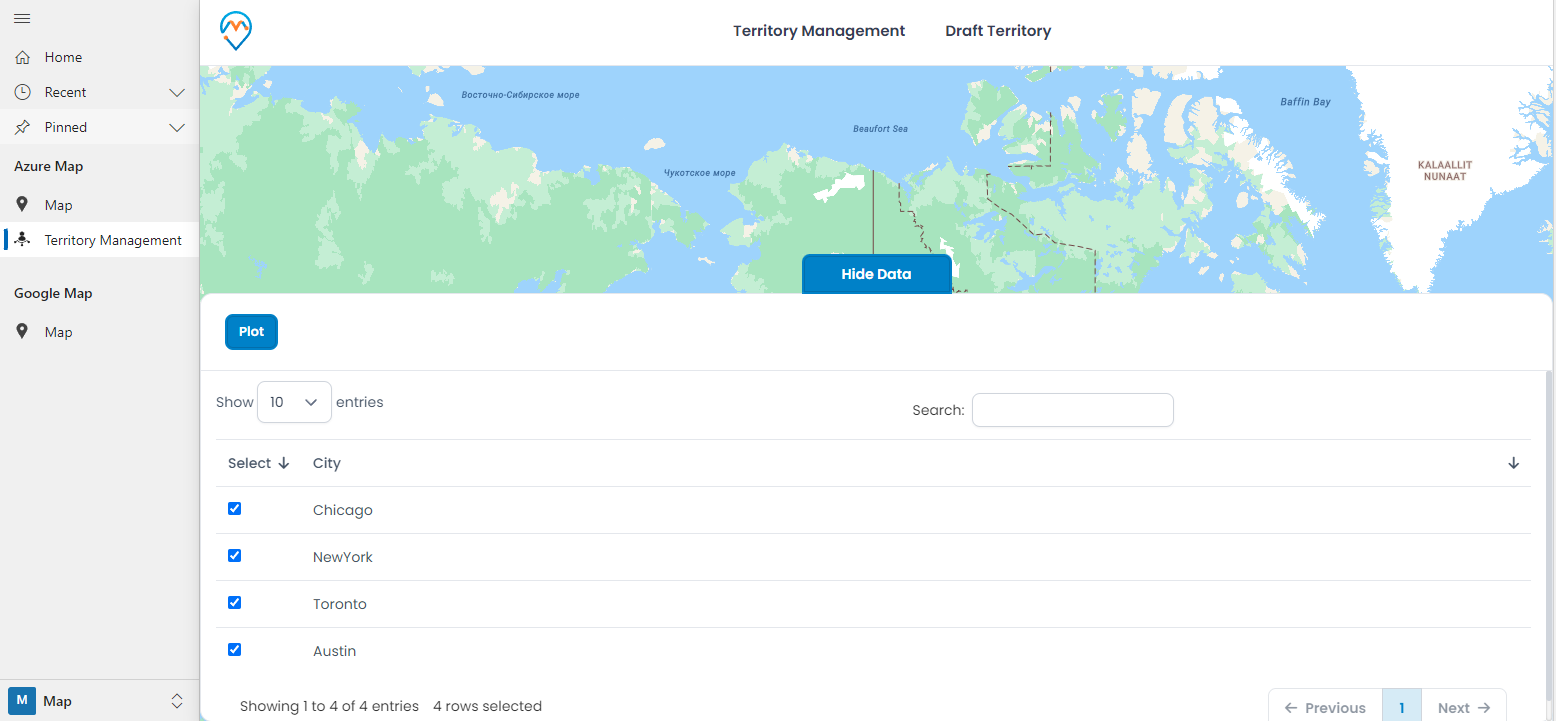
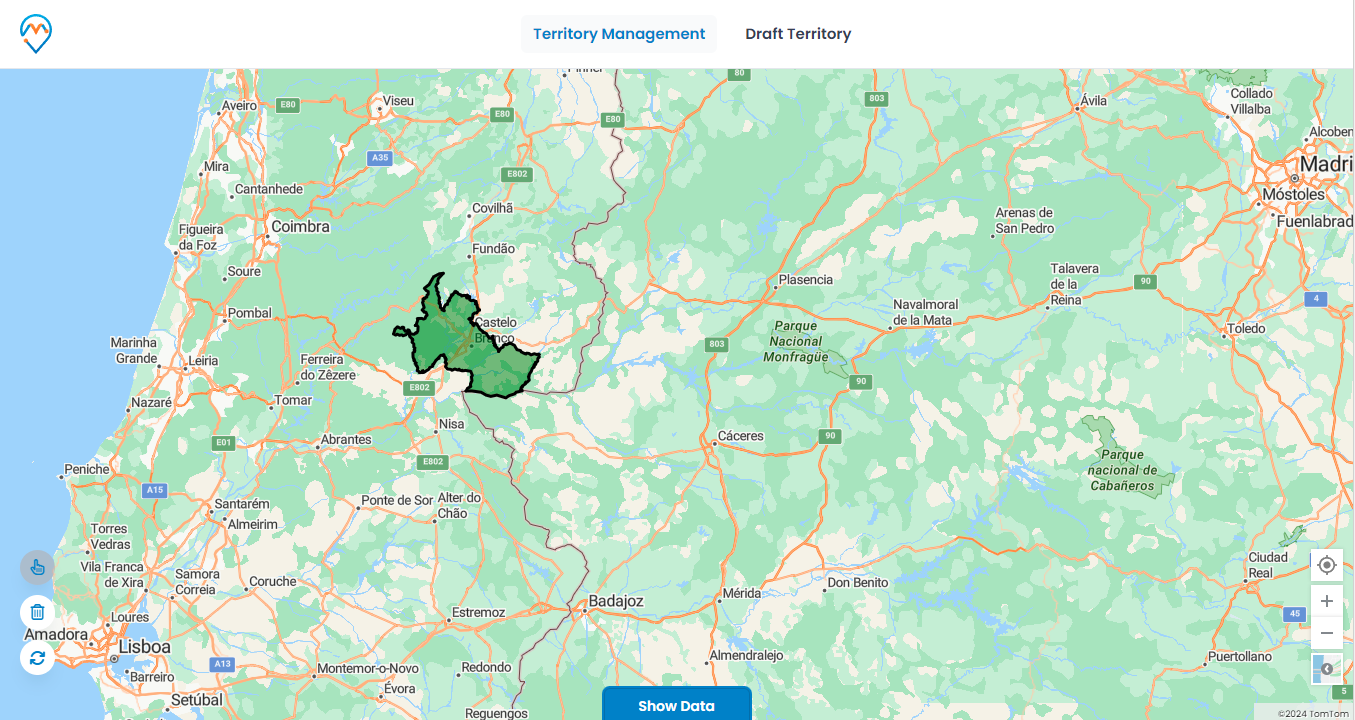
Click on the ‘Show Data’ button, and a slider will appear from the bottom. You will see all the states in the data grid view as per the CSV file.
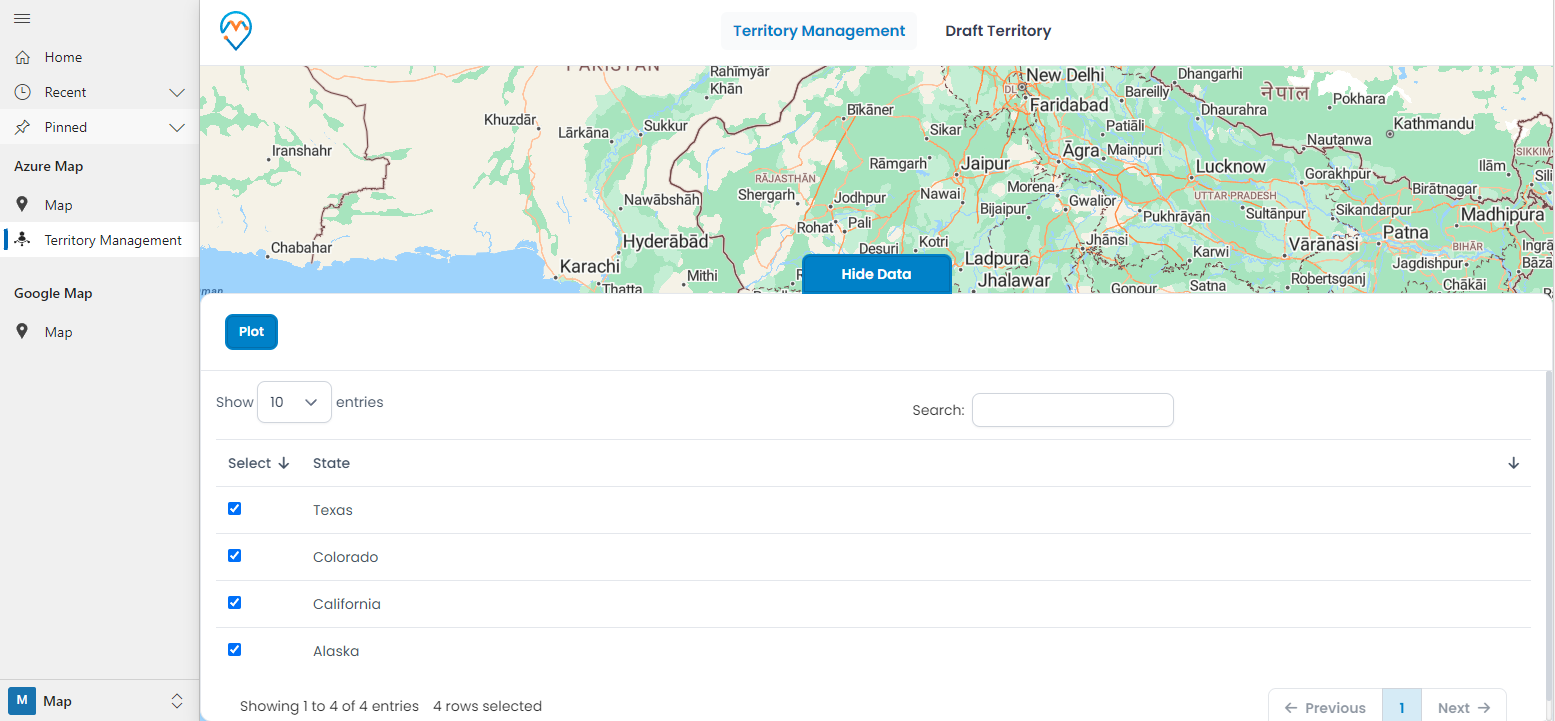
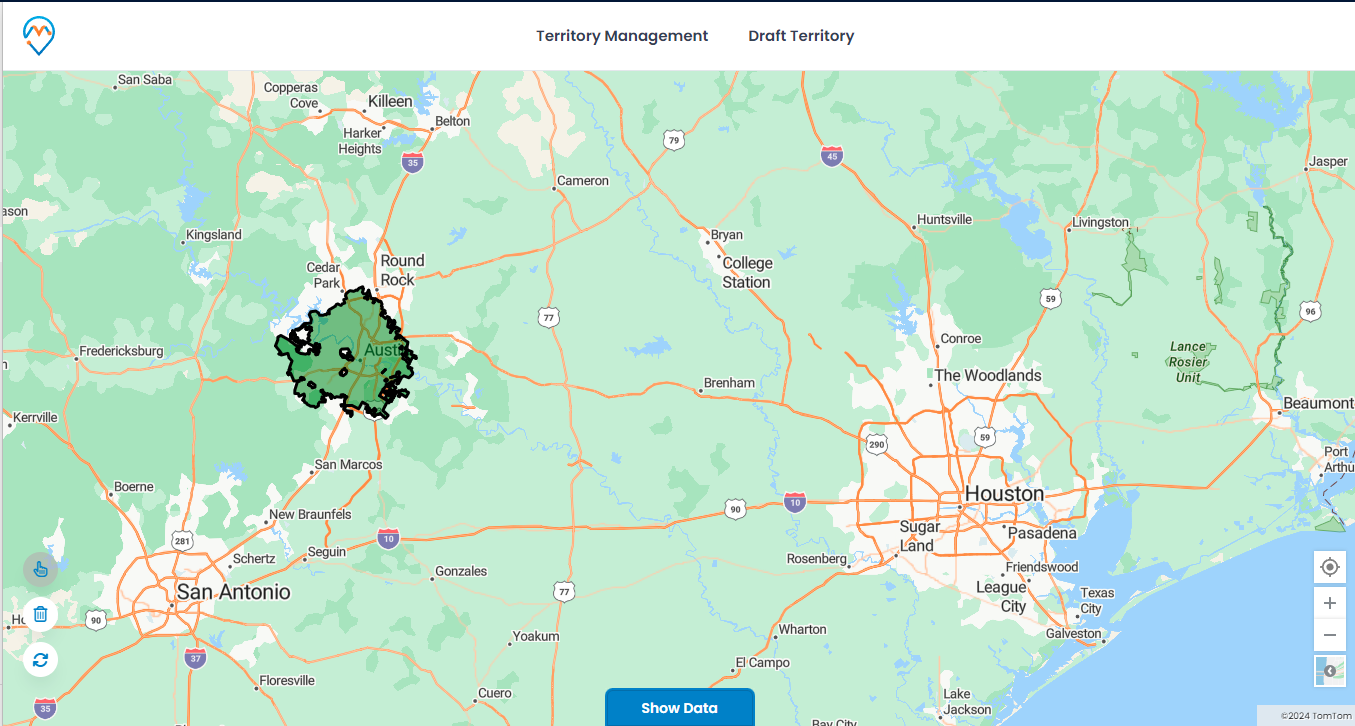
Now, select the state(s) you want to plot on the map to create the territory, and click on the ‘Plot’ button to add the geographical view of the CSV file. It will then plot all the selected states on the map.
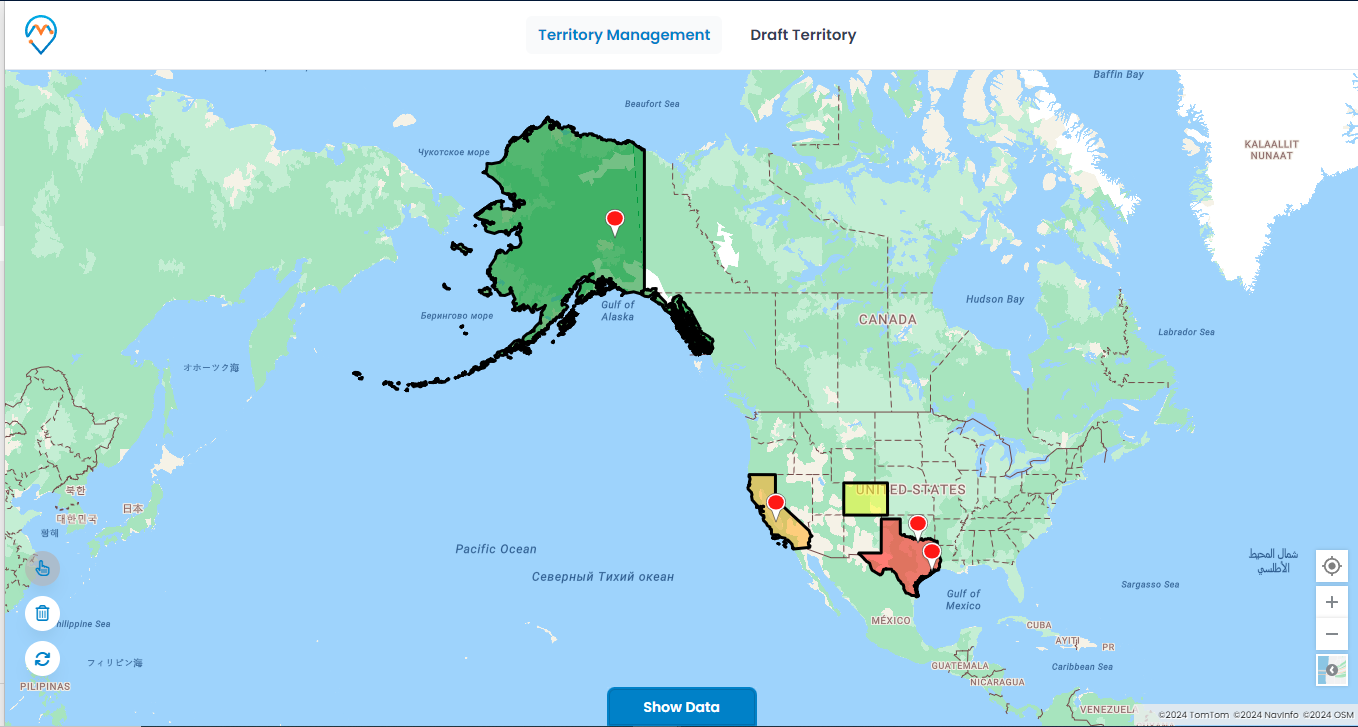
You need to enable the selection tool and select the states.
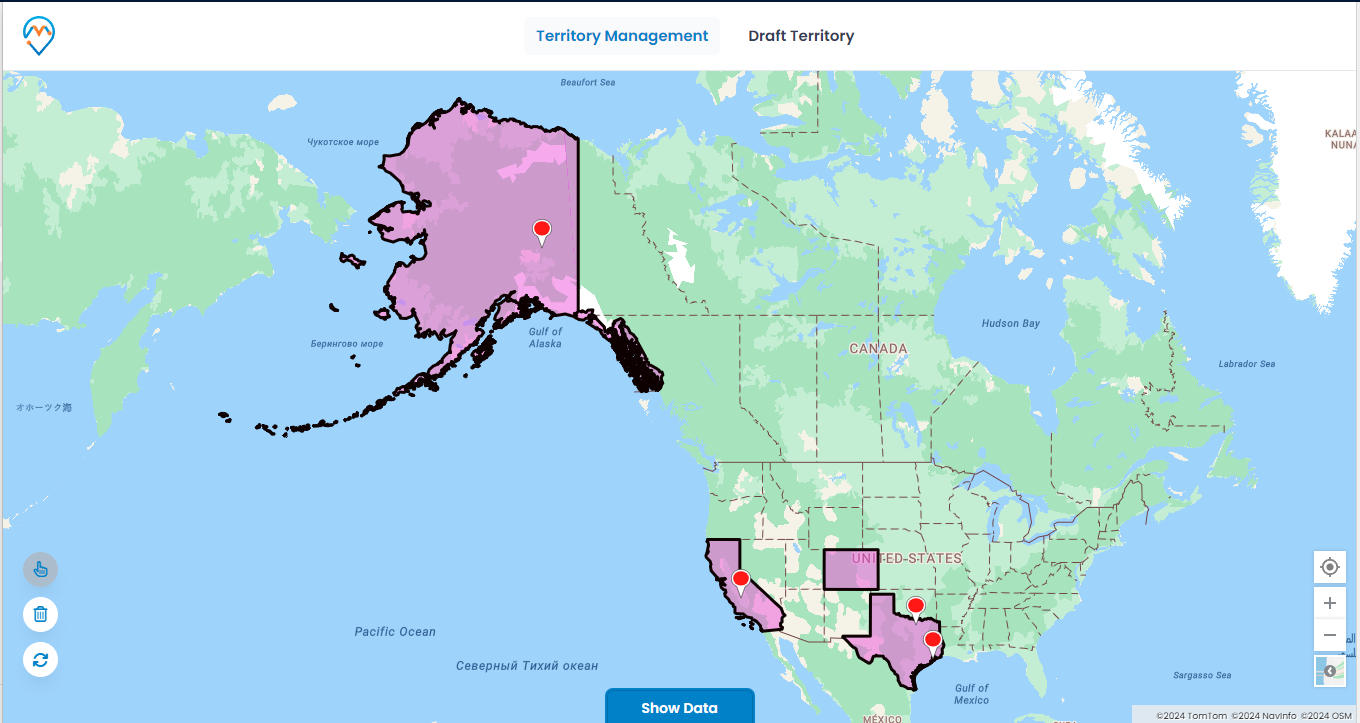
After selecting the states, right-click on the selected areas (states), and you will see the ‘Create New Territory’ option.
By clicking on ‘Create New Territory,’ you will open the ‘+ Create New Territory’ popup, from where you can create and manage the territory.
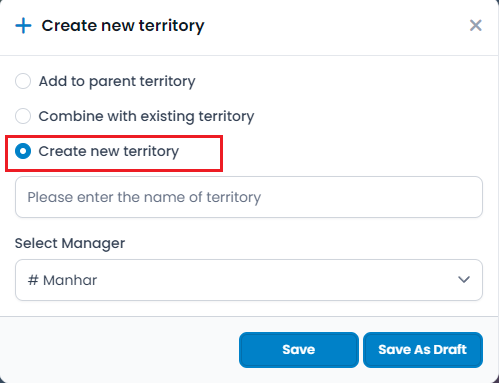
You can either merge the territories by selecting the ‘Combine Existing Territory’ option or create an entirely new territory by selecting the ‘Create New Territory’ option. You will need to insert the territory’s name and assign CRM users (Managers) to the territory.
Step 3.2: Select City
Similarly, after uploading the CSV file, you can select ‘City’ as the region and plot the territory on the map.
Once you select the ‘City,’ click on the Plot to add the geographical data to the map. You need to select the imported cities from the data grid.
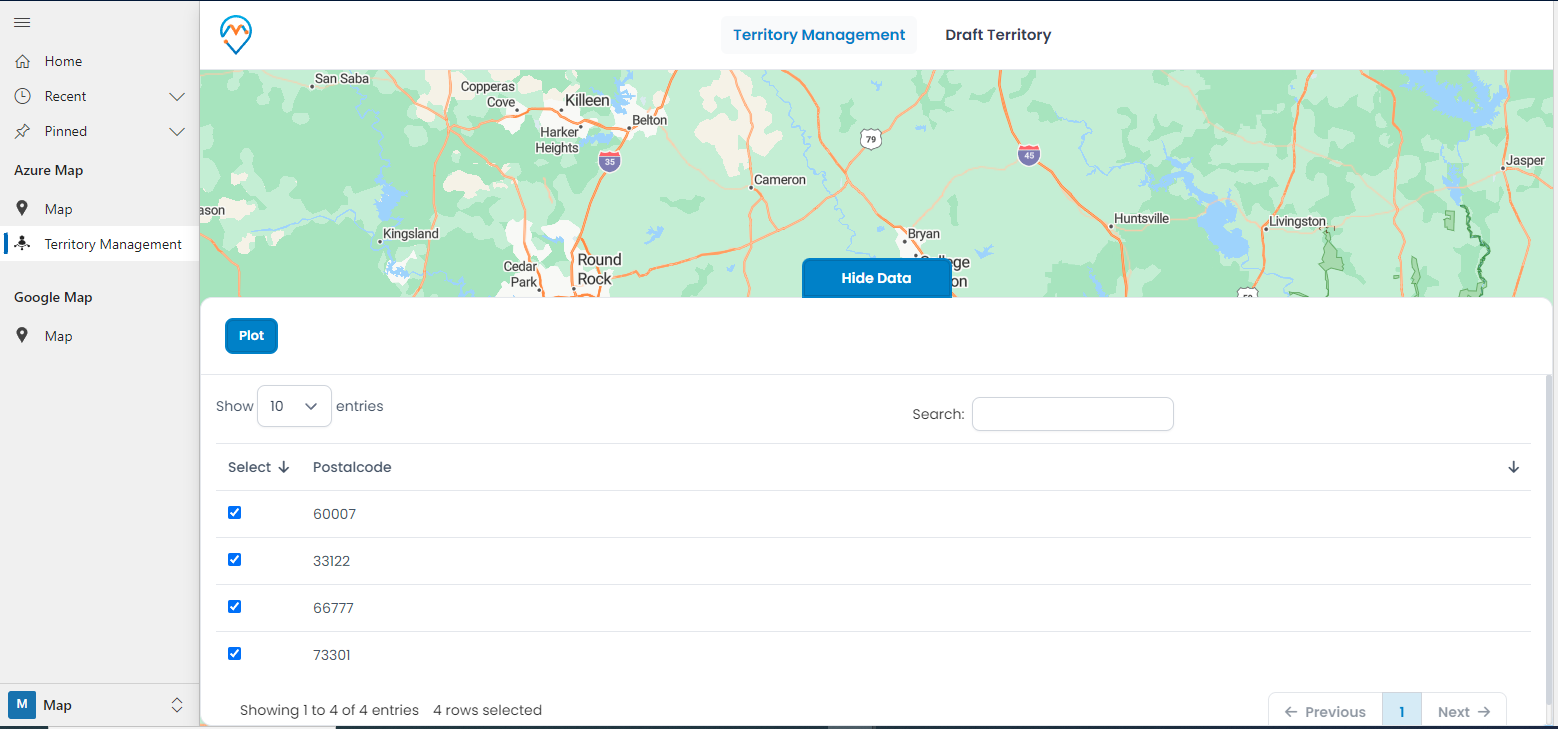
Step 3.3: Select Postal Code
Similarly, after uploading the CSV file, you can select the ‘Postal Code’ for a region and plot the area on the map.
Once you select the ‘Postal Code,’ click on the plot to add the geographical data to the map. You need to select the imported postal codes from the data grid.
In this way, you can import the CSV file onto the territory map and manage the territories according to the sales activities and fieldwork of the sales reps within the MappyField 365 map. This will help sales managers or Dynamics CRM users with administrator rights to reach out to the end-users.
AppJetty MappyField 365 is a geo-analytical plugin for Microsoft Dynamics 365, allowing you to plot Dynamics 365 records on the map. You can manage teams and CRM records directly on the map using the many user-friendly and advanced features of MappyField 365.
All product and company names are trademarks™, registered® or copyright© trademarks of their respective holders. Use of them does not imply any affiliation with or endorsement by them.


