Visualizing records on a map makes it easier to comprehend and organize data in Dynamics CRM.
For instance, using Mappyfield, one can plot multiple records simultaneously, allowing for an overall view of the data across the different regions.
Unlike the basic CRM map feature, Mappyfield can draw shapes to pinpoint the exact regions one wants to define. This means that you can easily search for records within a specific boundary, which will effectively help in locating the desired information according to the geographical area it serves.
You can search by region, user, or distance to meet your specified needs and get the desired data. Drawing a map is most appropriate when dealing with sales and marketing information, as it brings out the data in the specific areas of interest.
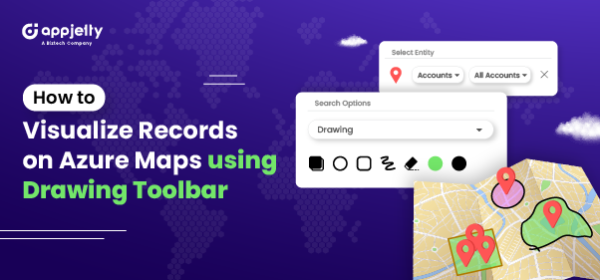
In this blog, we will explain how to use the drawing toolbar to draw your records in the shape that you want on the map.
Step 1: Redirect to the “Map” page
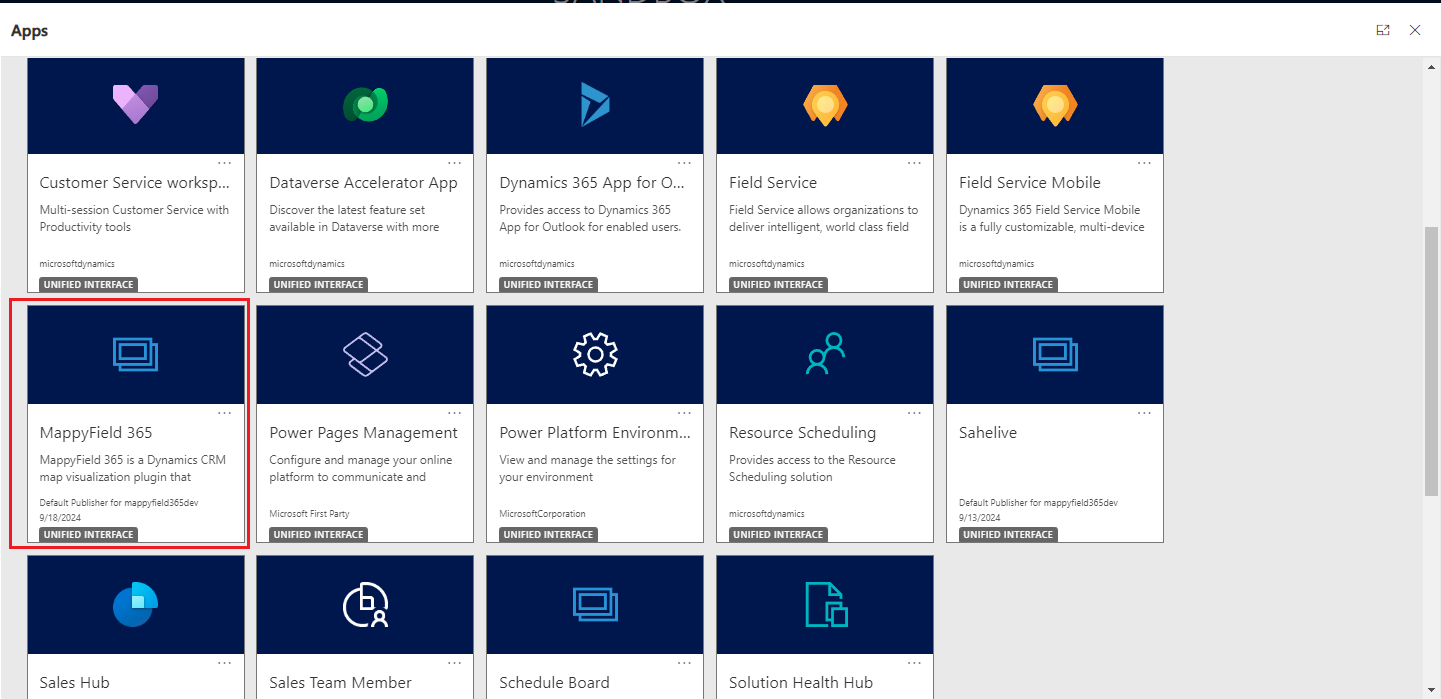
Once you’ve logged into Dynamics 365, select “MappyField 365” from the app’s dashboard.
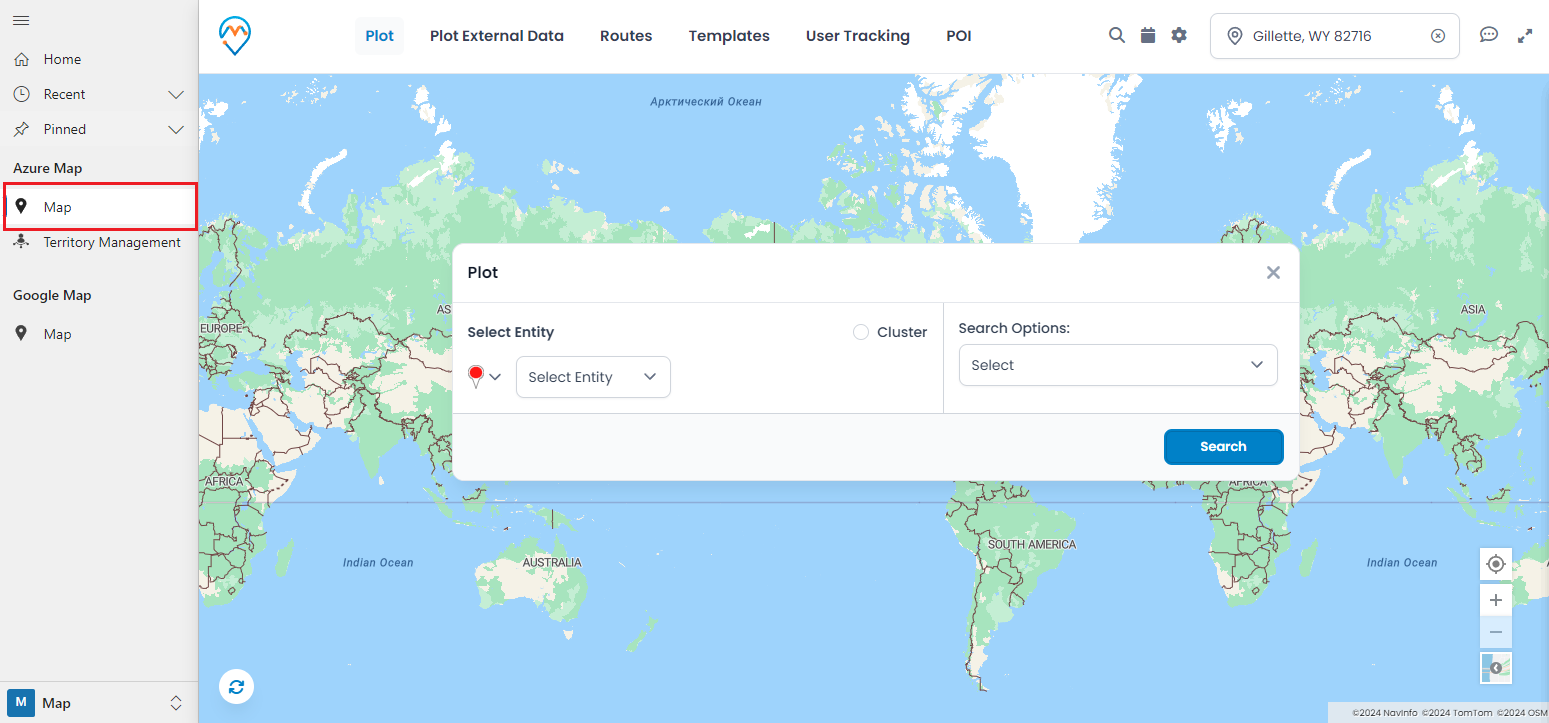
Step 2: Select the required entity and its view from the Select Entity option and select “Drawing” from Search Options
Selecting the Drawing option activates the Drawing Toolbar, providing access to various tools.
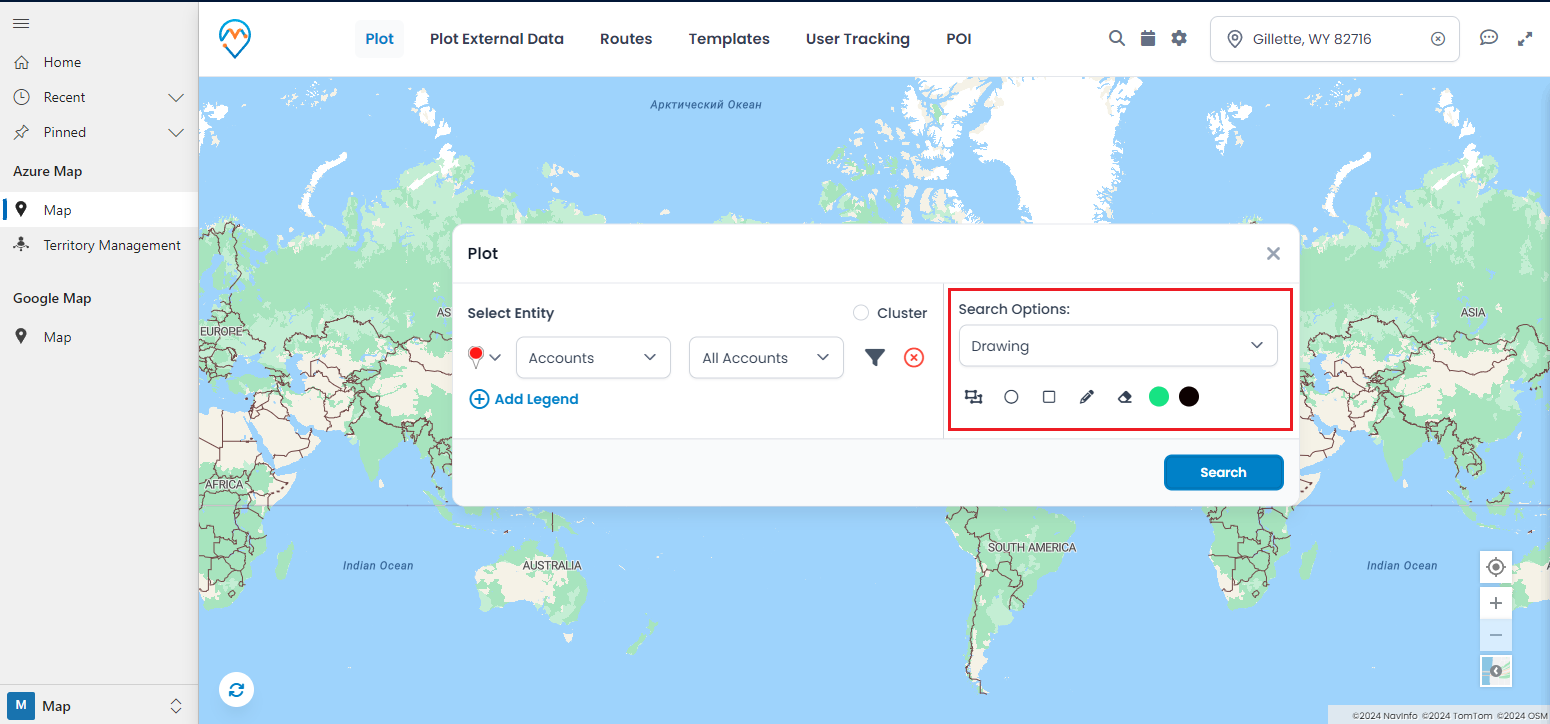
Step 3: Use the ‘Drawing toolbar’ to draw the desired shape on Map
– Polygon: Use this tool to draw a polygon with the desired size and number of sides.
– Circle: Use this tool to draw a circle.
– Rectangle: Use this tool to draw a rectangle.
Additional tools allow you to edit shapes and adjust their colors:
– Edit: Modify or resize any drawn shape using this tool.
– Erase: Remove any drawn shape from the map with this tool.
– Fill Color: Set or change the shape’s fill color.
– Stroke Color: Set or change the shape’s border color.
Step 4: Visualize data from the drawn shape on the map
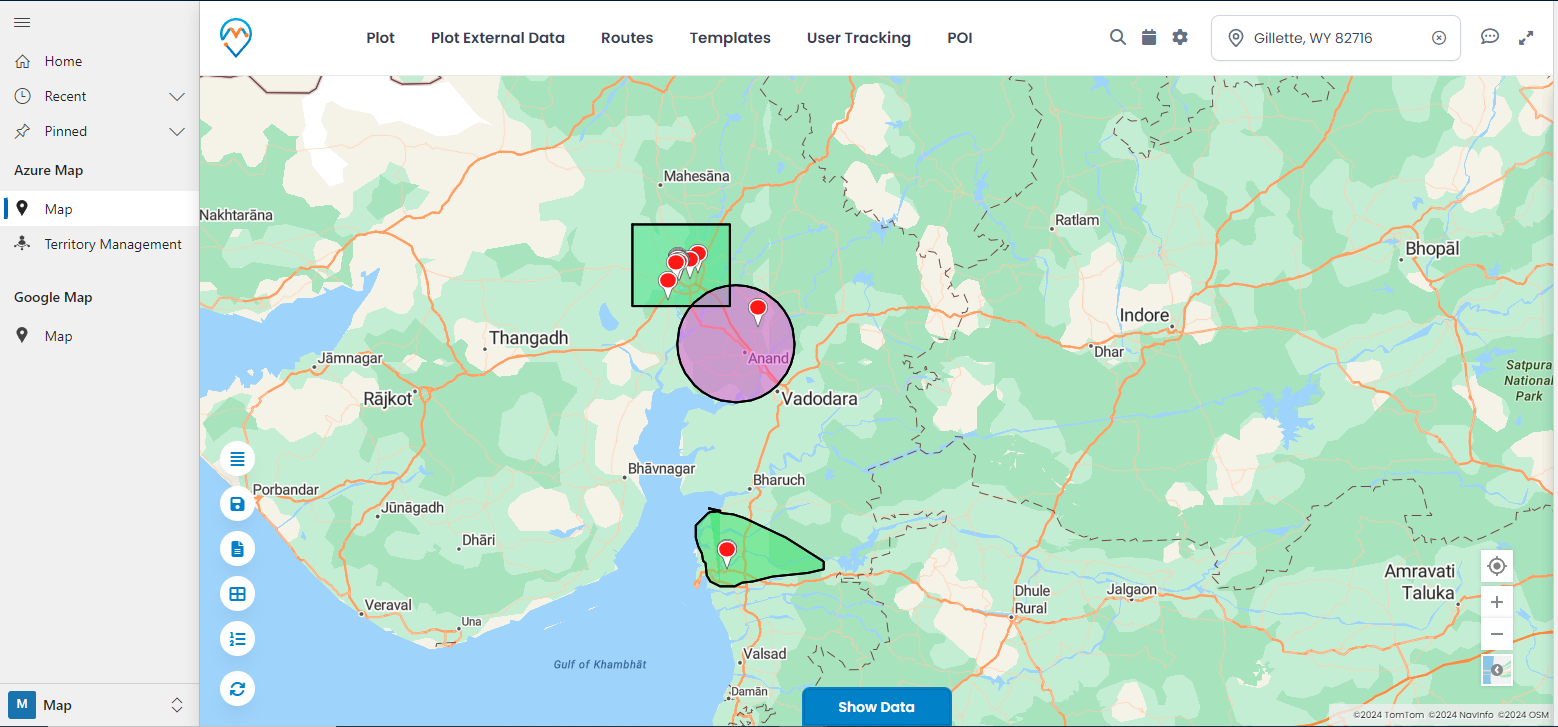
– You can add multiple shapes to the map.
– Once a shape is drawn, click the “Search” button to display data within that shape on the map. The data will be shown within the selected shape.
– Clicking on any shape will display a summary card for the selected shape and refresh the data in the data grid accordingly.
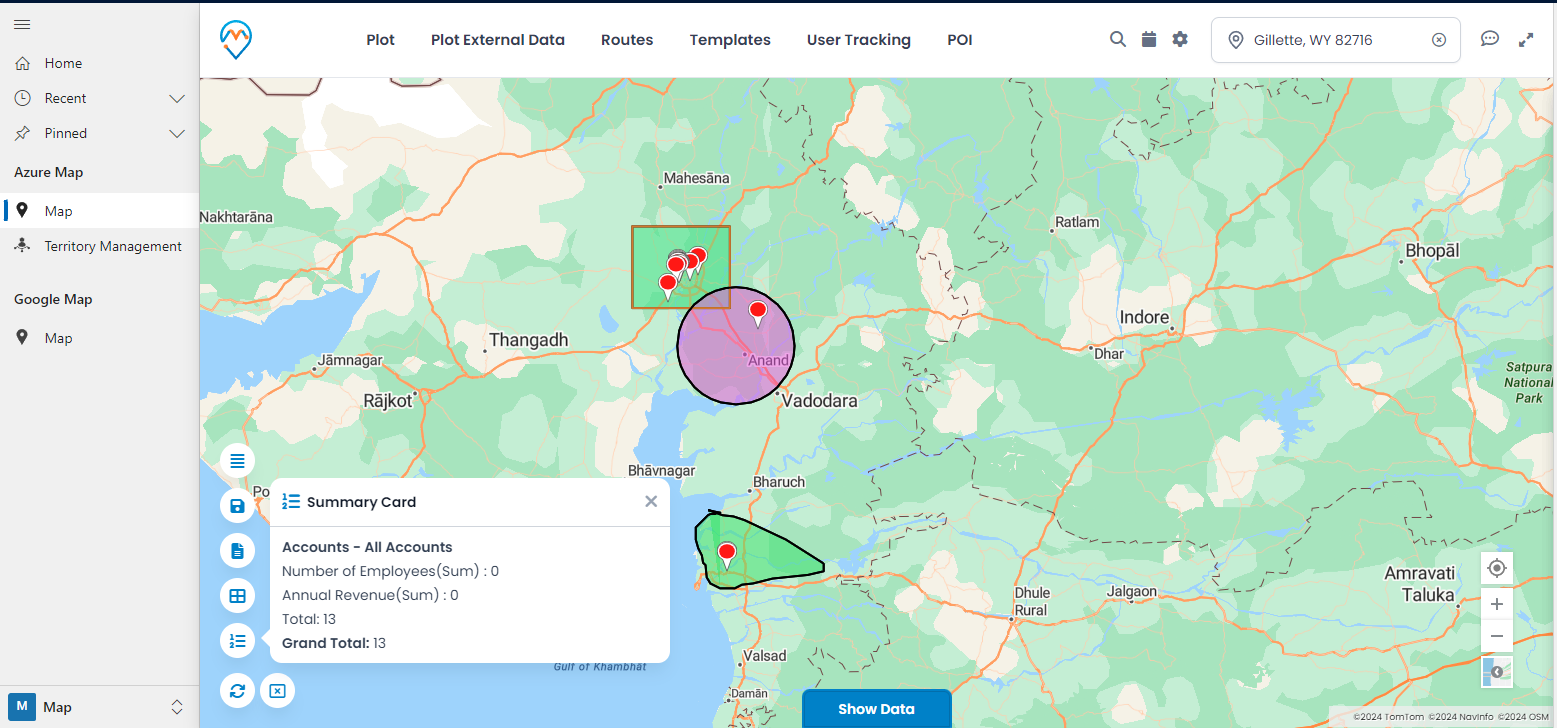
The ability to retrieve records on a map based on a drawn shape is often called “User-Editable Shapes.” This feature allows users to draw, modify, and remove shapes according to their needs
Integrating shape-drawing capabilities within Dynamics CRM mapping makes it simple to visualize and review records of selected entities within specific areas, whether by city, state, or region.
All product and company names are trademarks™, registered® or copyright© trademarks of their respective holders. Use of them does not imply any affiliation with or endorsement by them.


